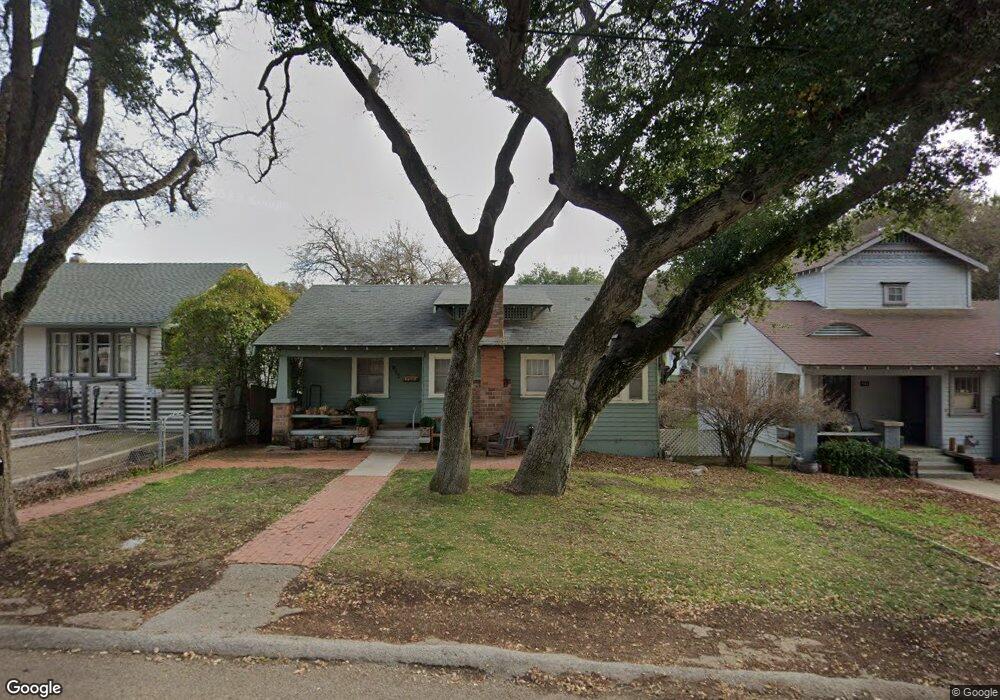
120 17th St Paso Robles, CA 93446
Estimated Value: $522,000 - $688,000
2
Beds
2
Baths
845
Sq Ft
$727/Sq Ft
Est. Value
About This Home
This home is located at 120 17th St, Paso Robles, CA 93446 and is currently estimated at $614,665, approximately $727 per square foot. 120 17th St is a home located in San Luis Obispo County with nearby schools including Glen Speck Elementary School, George H. Flamson Middle School, and Paso Robles High School.
Ownership History
Date
Name
Owned For
Owner Type
Purchase Details
Closed on
Nov 2, 2016
Sold by
Allen Beth E and Allen Stuart
Bought by
Madden James A and Elliott Anna
Current Estimated Value
Purchase Details
Closed on
Oct 15, 2010
Sold by
Allen Beth E and Davidson Jamie
Bought by
Allen Beth E and Allen Stuart A
Purchase Details
Closed on
Jul 28, 2010
Sold by
Allen Beth E and Allen Stuart A
Bought by
Allen Beth E and Davidson Jamie
Purchase Details
Closed on
Feb 23, 2007
Sold by
Allen Beth E
Bought by
Allen Beth E and Allen Stuart A
Purchase Details
Closed on
Apr 18, 2002
Sold by
Allen Beth E
Bought by
Allen Beth E
Purchase Details
Closed on
Sep 4, 1998
Sold by
Allen Beth E
Bought by
Allen Beth E and Allen Stuart M
Home Financials for this Owner
Home Financials are based on the most recent Mortgage that was taken out on this home.
Original Mortgage
$58,500
Interest Rate
6.89%
Create a Home Valuation Report for This Property
The Home Valuation Report is an in-depth analysis detailing your home's value as well as a comparison with similar homes in the area
Purchase History
| Date | Buyer | Sale Price | Title Company |
|---|---|---|---|
| Madden James A | $280,000 | First American Title Company | |
| Allen Beth E | -- | First American Title Company | |
| Allen Beth E | -- | None Available | |
| Allen Beth E | -- | None Available | |
| Allen Beth E | -- | -- | |
| Allen Beth E | $29,500 | First American Title Ins Co |
Source: Public Records
Mortgage History
| Date | Status | Borrower | Loan Amount |
|---|---|---|---|
| Previous Owner | Allen Beth E | $58,500 |
Source: Public Records
Tax History
| Year | Tax Paid | Tax Assessment Tax Assessment Total Assessment is a certain percentage of the fair market value that is determined by local assessors to be the total taxable value of land and additions on the property. | Land | Improvement |
|---|---|---|---|---|
| 2025 | $3,542 | $324,958 | $226,311 | $98,647 |
| 2024 | $3,484 | $318,587 | $221,874 | $96,713 |
| 2023 | $3,484 | $312,341 | $217,524 | $94,817 |
| 2022 | $3,432 | $306,217 | $213,259 | $92,958 |
| 2021 | $3,374 | $300,214 | $209,078 | $91,136 |
| 2020 | $3,328 | $297,137 | $206,935 | $90,202 |
| 2019 | $3,281 | $291,312 | $202,878 | $88,434 |
| 2018 | $3,236 | $285,600 | $198,900 | $86,700 |
| 2017 | $3,043 | $280,000 | $195,000 | $85,000 |
| 2016 | $1,838 | $176,088 | $118,337 | $57,751 |
| 2015 | $1,830 | $173,444 | $116,560 | $56,884 |
| 2014 | $1,764 | $170,047 | $114,277 | $55,770 |
Source: Public Records
Map
Nearby Homes
Your Personal Tour Guide
Ask me questions while you tour the home.