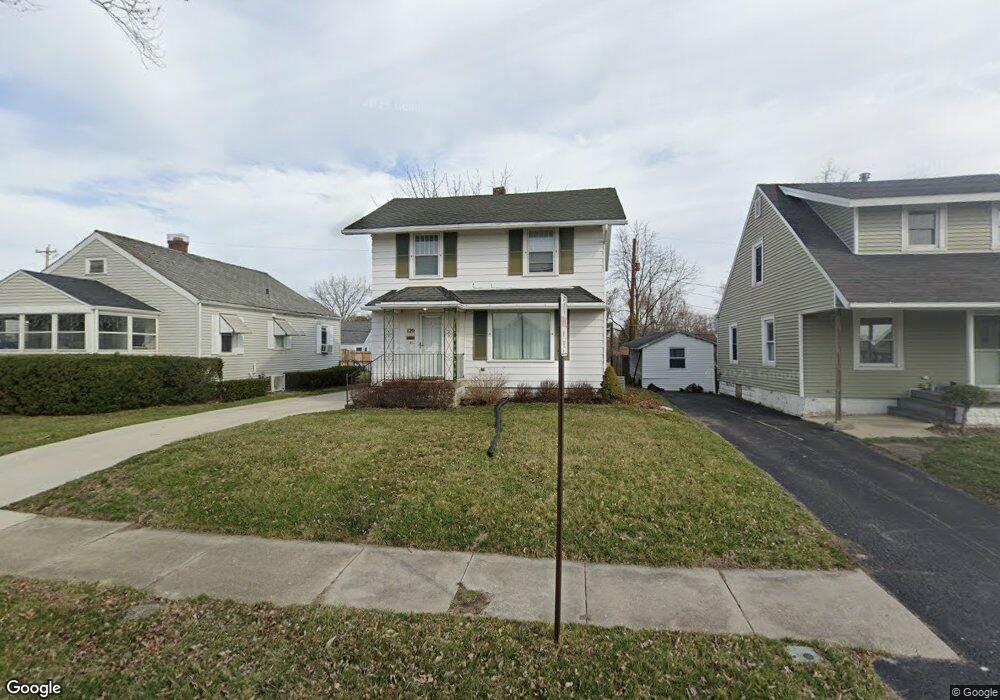
120 19th St Findlay, OH 45840
Estimated Value: $154,658 - $183,000
3
Beds
2
Baths
1,212
Sq Ft
$139/Sq Ft
Est. Value
About This Home
This home is located at 120 19th St, Findlay, OH 45840 and is currently estimated at $168,915, approximately $139 per square foot. 120 19th St is a home located in Hancock County with nearby schools including Northview Elementary School, Bigelow Hill Elementary School, and Glenwood Middle School.
Ownership History
Date
Name
Owned For
Owner Type
Purchase Details
Closed on
Dec 19, 2023
Sold by
Like Kevin D and Like Randall N
Bought by
Drewes Mark R and Drewes Melody
Current Estimated Value
Purchase Details
Closed on
Sep 30, 2005
Sold by
Hardin Holly A and Hardin Jeffrey L
Bought by
Stillberger Christopher L and Stillberger Brigida R
Home Financials for this Owner
Home Financials are based on the most recent Mortgage that was taken out on this home.
Original Mortgage
$49,500
Interest Rate
5.93%
Mortgage Type
Fannie Mae Freddie Mac
Create a Home Valuation Report for This Property
The Home Valuation Report is an in-depth analysis detailing your home's value as well as a comparison with similar homes in the area
Home Values in the Area
Average Home Value in this Area
Purchase History
| Date | Buyer | Sale Price | Title Company |
|---|---|---|---|
| Drewes Mark R | -- | None Listed On Document | |
| Stillberger Christopher L | $55,000 | Golden Key Title Agency |
Source: Public Records
Mortgage History
| Date | Status | Borrower | Loan Amount |
|---|---|---|---|
| Previous Owner | Stillberger Christopher L | $49,500 |
Source: Public Records
Tax History Compared to Growth
Tax History
| Year | Tax Paid | Tax Assessment Tax Assessment Total Assessment is a certain percentage of the fair market value that is determined by local assessors to be the total taxable value of land and additions on the property. | Land | Improvement |
|---|---|---|---|---|
| 2024 | $1,313 | $36,010 | $4,280 | $31,730 |
| 2023 | $1,315 | $36,010 | $4,280 | $31,730 |
| 2022 | $1,310 | $36,010 | $4,280 | $31,730 |
| 2021 | $1,320 | $31,600 | $4,290 | $27,310 |
| 2020 | $1,320 | $31,600 | $4,290 | $27,310 |
| 2019 | $1,294 | $31,600 | $4,290 | $27,310 |
| 2018 | $1,226 | $27,470 | $3,730 | $23,740 |
| 2017 | $613 | $27,470 | $3,730 | $23,740 |
| 2016 | $1,218 | $27,470 | $3,730 | $23,740 |
| 2015 | $1,058 | $23,520 | $3,430 | $20,090 |
| 2014 | $1,058 | $23,520 | $3,430 | $20,090 |
| 2012 | $1,066 | $23,520 | $3,430 | $20,090 |
Source: Public Records
Map
Nearby Homes
- 1825 Pershing St
- 1820 N Main St
- 1934 Geffs Ave
- 2100 Candlewick Dr
- 304 Prentiss Ave
- 304 Rector Ave
- 405 Clifton Ave
- 334 E Foulke Ave
- 410 Monroe Ave
- 231 Tioga Ave
- 600 Charles Ave
- 206 Midland Ave
- 230 Midland Ave
- 1908 Gayle Ln
- 420 Allen Ave
- 128 Harrington Ave
- 715 Christina Ct
- 115 George St
- 643 Edith Ave
- 604 Davis St