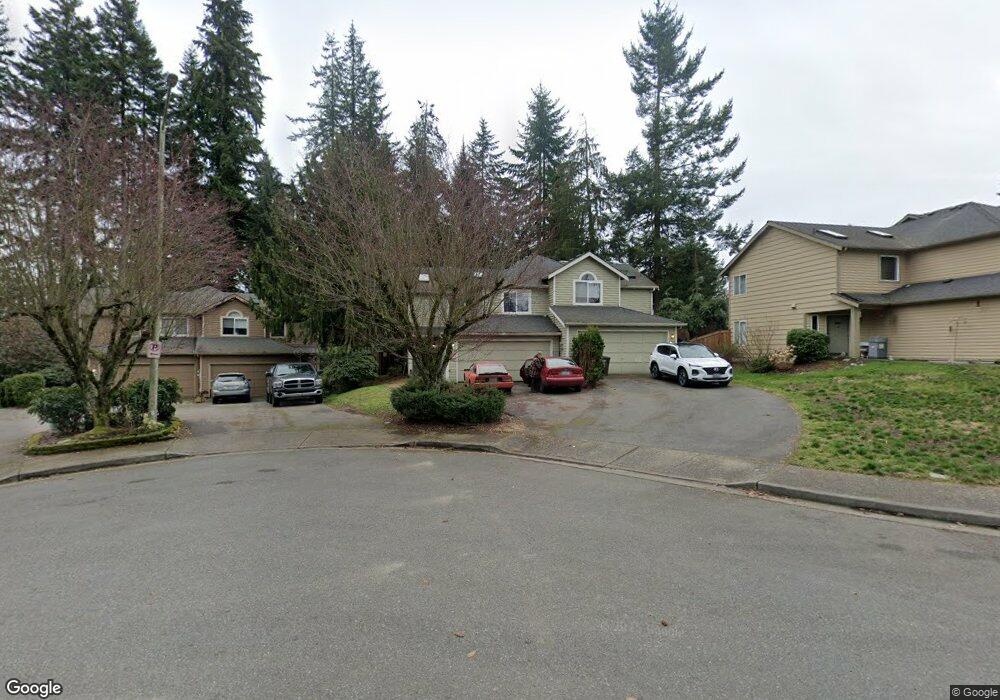
120 69th Place SE Unit 120B Everett, WA 98203
Evergreen NeighborhoodEstimated Value: $477,000 - $584,000
3
Beds
3
Baths
1,288
Sq Ft
$418/Sq Ft
Est. Value
About This Home
This home is located at 120 69th Place SE Unit 120B, Everett, WA 98203 and is currently estimated at $537,741, approximately $417 per square foot. 120 69th Place SE Unit 120B is a home located in Snohomish County with nearby schools including Madison Elementary School, Evergreen Middle School, and Cascade High School.
Ownership History
Date
Name
Owned For
Owner Type
Purchase Details
Closed on
Dec 13, 2011
Sold by
Zegarra Renzo A and Sawyer Kari S
Bought by
Melenda Katie L
Current Estimated Value
Home Financials for this Owner
Home Financials are based on the most recent Mortgage that was taken out on this home.
Original Mortgage
$126,704
Outstanding Balance
$88,280
Interest Rate
4.4%
Mortgage Type
FHA
Estimated Equity
$449,461
Purchase Details
Closed on
Feb 27, 2008
Sold by
Soine Karen C and Wiese Karen C
Bought by
Zegarra Renzo A and Sawyer Kari S
Home Financials for this Owner
Home Financials are based on the most recent Mortgage that was taken out on this home.
Original Mortgage
$277,643
Interest Rate
5.64%
Mortgage Type
FHA
Purchase Details
Closed on
Jun 12, 1998
Sold by
Lozeau Marcia B
Bought by
Wiese Karen C
Home Financials for this Owner
Home Financials are based on the most recent Mortgage that was taken out on this home.
Original Mortgage
$123,000
Interest Rate
7.17%
Create a Home Valuation Report for This Property
The Home Valuation Report is an in-depth analysis detailing your home's value as well as a comparison with similar homes in the area
Home Values in the Area
Average Home Value in this Area
Purchase History
| Date | Buyer | Sale Price | Title Company |
|---|---|---|---|
| Melenda Katie L | $130,000 | Wfg Natl Title | |
| Zegarra Renzo A | $282,000 | Pnwt | |
| Soine Karen C | $56,179 | Pnwt | |
| Wiese Karen C | $137,000 | -- |
Source: Public Records
Mortgage History
| Date | Status | Borrower | Loan Amount |
|---|---|---|---|
| Open | Melenda Katie L | $126,704 | |
| Previous Owner | Zegarra Renzo A | $277,643 | |
| Previous Owner | Wiese Karen C | $123,000 |
Source: Public Records
Tax History Compared to Growth
Tax History
| Year | Tax Paid | Tax Assessment Tax Assessment Total Assessment is a certain percentage of the fair market value that is determined by local assessors to be the total taxable value of land and additions on the property. | Land | Improvement |
|---|---|---|---|---|
| 2025 | $4,515 | $522,000 | $191,500 | $330,500 |
| 2024 | $4,515 | $524,500 | $182,500 | $342,000 |
| 2023 | $3,857 | $468,500 | $178,000 | $290,500 |
| 2022 | $3,309 | $360,500 | $163,500 | $197,000 |
| 2020 | $3,712 | $330,000 | $91,500 | $238,500 |
| 2019 | $3,208 | $287,000 | $79,000 | $208,000 |
| 2018 | $3,182 | $261,000 | $71,500 | $189,500 |
| 2017 | $2,497 | $204,000 | $49,500 | $154,500 |
| 2016 | $2,179 | $187,000 | $48,000 | $139,000 |
| 2015 | $1,881 | $152,000 | $34,000 | $118,000 |
| 2013 | $2,049 | $146,200 | $34,000 | $112,200 |
Source: Public Records
Map
Nearby Homes
- 6520 Cypress St
- 323 75th St SE Unit A14
- 606 Morgan Rd
- 9 76th St SE
- 615 75th St SE Unit C44
- 615 75th St SE Unit C52
- 209 76th St SE
- 6315 W Beech St
- 820 Cady Rd Unit J206
- 820 Cady Rd Unit E102
- 820 Cady Rd Unit J305
- 820 Cady Rd Unit H304
- 7622 Easy St
- 6705 Cady Rd
- 415 Rose Way
- 820 E Cady Rd Unit G205
- 6208 Sycamore Place
- 6314 Cady Rd
- 7109 Rainier Dr Unit G
- 7027 Rainier Dr Unit C
- 120 69th Place SE Unit A
- 120 69th Place SE Unit 120A
- 132 69th Place SE Unit 132B
- 132 69th Place SE Unit 132A
- 124 69th Place SE Unit 124B
- 124 69th Place SE Unit 124A
- 124 69th Place SE Unit A
- 132 69th Place SE Unit B
- 128 69th Place SE Unit 128B
- 128 69th Place SE Unit 128A
- 116 69th Place SE Unit 116B
- 116 69th Place SE Unit 116A
- 116 69th Place SE Unit B
- 123 69th Place SE
- 6931 Lower Ridge Rd
- 6925 Lower Ridge Rd
- 7023 Lower Ridge Rd
- 7015 Lower Ridge Rd
- 6911 Lower Ridge Rd