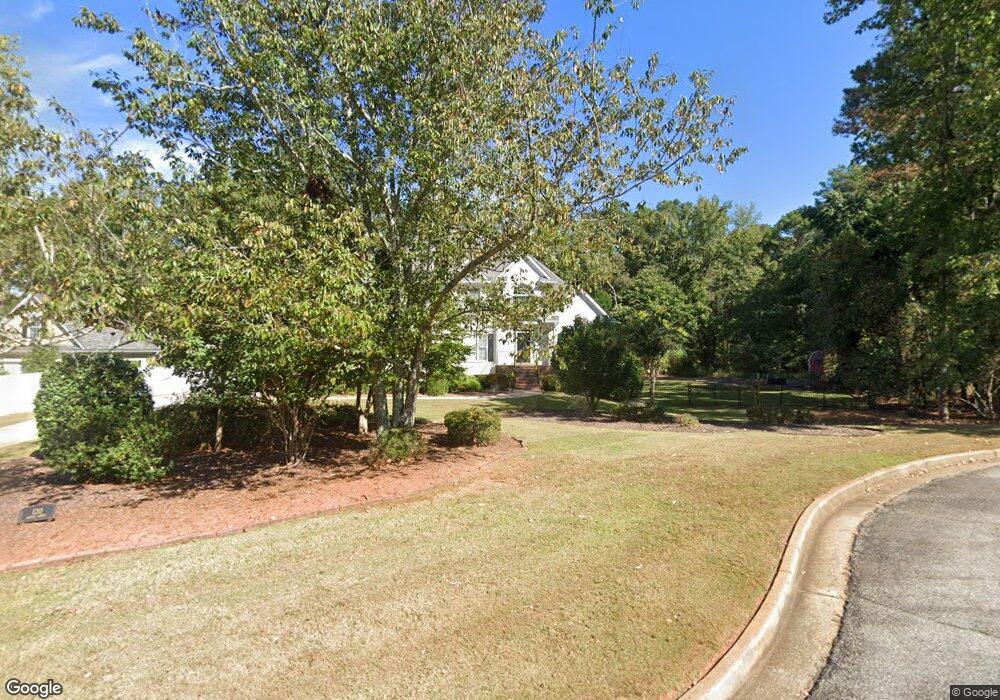
120 Arden Ct Peachtree City, GA 30269
Estimated Value: $864,000 - $1,149,000
--
Bed
1
Bath
3,134
Sq Ft
$319/Sq Ft
Est. Value
About This Home
This home is located at 120 Arden Ct, Peachtree City, GA 30269 and is currently estimated at $998,610, approximately $318 per square foot. 120 Arden Ct is a home located in Fayette County with nearby schools including Crabapple Lane Elementary School, Booth Middle School, and McIntosh High School.
Ownership History
Date
Name
Owned For
Owner Type
Purchase Details
Closed on
Aug 2, 2012
Sold by
Choi Brice Byung-Il
Bought by
Choi Eun W
Current Estimated Value
Purchase Details
Closed on
Mar 6, 2001
Sold by
Chol Brice B
Bought by
Chol Brice B and Chol Eun W
Home Financials for this Owner
Home Financials are based on the most recent Mortgage that was taken out on this home.
Original Mortgage
$320,000
Interest Rate
7.12%
Mortgage Type
New Conventional
Purchase Details
Closed on
Feb 19, 1998
Sold by
Hogan Michael J and Hogan Jo A
Bought by
Tinsley Gregory S
Home Financials for this Owner
Home Financials are based on the most recent Mortgage that was taken out on this home.
Original Mortgage
$296,000
Interest Rate
6.12%
Mortgage Type
New Conventional
Purchase Details
Closed on
Dec 15, 1995
Sold by
Enterkin Homes
Bought by
Hogan Michael J Jo Anne
Purchase Details
Closed on
Jun 28, 1995
Sold by
Oliver Prop
Bought by
Enterkin Homes
Create a Home Valuation Report for This Property
The Home Valuation Report is an in-depth analysis detailing your home's value as well as a comparison with similar homes in the area
Home Values in the Area
Average Home Value in this Area
Purchase History
| Date | Buyer | Sale Price | Title Company |
|---|---|---|---|
| Choi Eun W | -- | -- | |
| Chol Brice B | -- | -- | |
| Chol Brice B | $400,000 | -- | |
| Tinsley Gregory S | $370,000 | -- | |
| Hogan Michael J Jo Anne | $334,200 | -- | |
| Enterkin Homes | $44,900 | -- | |
| Hogan Michael J Joanne | $55,000 | -- |
Source: Public Records
Mortgage History
| Date | Status | Borrower | Loan Amount |
|---|---|---|---|
| Previous Owner | Chol Brice B | $320,000 | |
| Previous Owner | Tinsley Gregory S | $296,000 | |
| Closed | Hogan Michael J Joanne | $0 |
Source: Public Records
Tax History Compared to Growth
Tax History
| Year | Tax Paid | Tax Assessment Tax Assessment Total Assessment is a certain percentage of the fair market value that is determined by local assessors to be the total taxable value of land and additions on the property. | Land | Improvement |
|---|---|---|---|---|
| 2024 | $7,386 | $423,584 | $38,000 | $385,584 |
| 2023 | $8,710 | $405,120 | $38,000 | $367,120 |
| 2022 | $8,754 | $381,880 | $38,000 | $343,880 |
| 2021 | $8,216 | $324,480 | $38,000 | $286,480 |
| 2020 | $8,646 | $305,960 | $38,000 | $267,960 |
| 2019 | $8,359 | $292,640 | $38,000 | $254,640 |
| 2018 | $7,881 | $272,720 | $38,000 | $234,720 |
| 2017 | $7,626 | $262,920 | $38,000 | $224,920 |
| 2016 | $7,002 | $236,240 | $38,000 | $198,240 |
| 2015 | $6,596 | $218,600 | $38,000 | $180,600 |
| 2014 | $6,256 | $203,760 | $38,000 | $165,760 |
| 2013 | -- | $201,600 | $0 | $0 |
Source: Public Records
Map
Nearby Homes
- 110 Twin Branch Walk
- 110 Old Mill Crossing
- 155 Aspen Way
- 804 Ridgestone Ct
- 104 Hidden Springs Ln
- 227 Oak Ridge Dr
- 806 Smokey Way
- 1746 Highway 54 W
- 1133 Astoria Ln
- 223 Chateau Dr
- 208 Regester Way
- 210 Regester Way
- 125 Seymour Place
- 313 Fayette Villa Ct
- 506 Avalon Dr
- 115 Seymour Place
- 159 Sims Rd
- 105 Arlington Trace
- 115 Stonington Dr
- 100 Hamilton Glen Ct
- 110 Arden Ct
- 130 Arden Ct
- 120 Twin Branch Walk
- 135 Arden Ct
- 125 Arden Ct Unit 70
- 125 Arden Ct
- 100 Arden Ct
- 115 Arden Ct
- 0 Arden Ct Unit 7240258
- 0 Arden Ct Unit 7137046
- 0 Arden Ct Unit 8426649
- 0 Arden Ct Unit 8373212
- 0 Arden Ct Unit 7615259
- 0 Arden Ct Unit 7510906
- 0 Arden Ct Unit 7072924
- 0 Arden Ct
- 165 Old Mill Point
- 0 Twin Branch Walk Unit 7121266
- 0 Twin Branch Walk Unit 8976662
- 0 Twin Branch Walk Unit 7090049