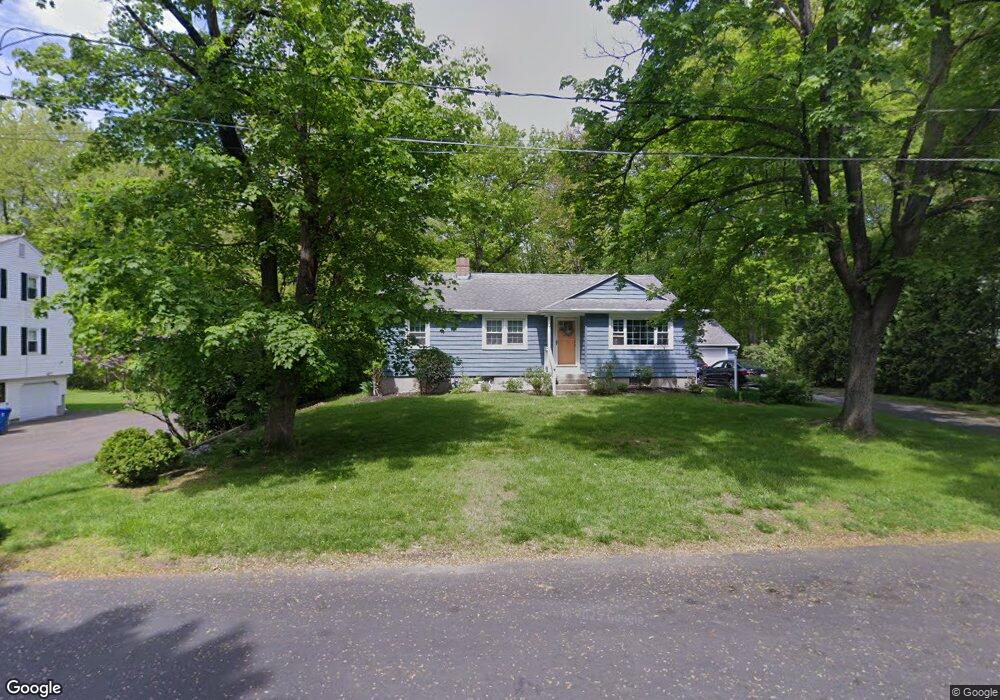
120 Autumn Rd West Springfield, MA 01089
Estimated Value: $330,000 - $387,000
3
Beds
1
Bath
1,204
Sq Ft
$293/Sq Ft
Est. Value
About This Home
This home is located at 120 Autumn Rd, West Springfield, MA 01089 and is currently estimated at $352,292, approximately $292 per square foot. 120 Autumn Rd is a home located in Hampden County with nearby schools including Hampden Charter School of Science West and St Thomas The Apostle School.
Ownership History
Date
Name
Owned For
Owner Type
Purchase Details
Closed on
Dec 30, 2010
Sold by
Monfette Louis R
Bought by
Blaser Charles and Blaser Elizabeth
Current Estimated Value
Home Financials for this Owner
Home Financials are based on the most recent Mortgage that was taken out on this home.
Original Mortgage
$170,563
Outstanding Balance
$113,278
Interest Rate
4.4%
Mortgage Type
FHA
Estimated Equity
$239,014
Purchase Details
Closed on
Feb 28, 2008
Sold by
Monfette Louis R and Monfette Margaret A
Bought by
Monfette Louis R
Purchase Details
Closed on
Jun 6, 1994
Sold by
Ahearn Michael J and Ahearn Margaret M
Bought by
Monfette Louis R and Monfette Margaret A
Home Financials for this Owner
Home Financials are based on the most recent Mortgage that was taken out on this home.
Original Mortgage
$92,000
Interest Rate
8.49%
Mortgage Type
Purchase Money Mortgage
Create a Home Valuation Report for This Property
The Home Valuation Report is an in-depth analysis detailing your home's value as well as a comparison with similar homes in the area
Home Values in the Area
Average Home Value in this Area
Purchase History
| Date | Buyer | Sale Price | Title Company |
|---|---|---|---|
| Blaser Charles | $175,000 | -- | |
| Monfette Louis R | -- | -- | |
| Monfette Louis R | $104,500 | -- |
Source: Public Records
Mortgage History
| Date | Status | Borrower | Loan Amount |
|---|---|---|---|
| Open | Blaser Charles | $170,563 | |
| Previous Owner | Monfette Louis R | $17,000 | |
| Previous Owner | Monfette Louis R | $106,250 | |
| Previous Owner | Monfette Louis R | $18,700 | |
| Previous Owner | Monfette Louis R | $92,000 |
Source: Public Records
Tax History Compared to Growth
Tax History
| Year | Tax Paid | Tax Assessment Tax Assessment Total Assessment is a certain percentage of the fair market value that is determined by local assessors to be the total taxable value of land and additions on the property. | Land | Improvement |
|---|---|---|---|---|
| 2025 | $4,155 | $279,400 | $125,800 | $153,600 |
| 2024 | $4,104 | $277,100 | $125,800 | $151,300 |
| 2023 | $3,966 | $255,200 | $125,800 | $129,400 |
| 2022 | $3,600 | $228,400 | $114,100 | $114,300 |
| 2021 | $3,559 | $210,600 | $106,200 | $104,400 |
| 2020 | $3,559 | $209,500 | $106,200 | $103,300 |
| 2019 | $3,553 | $209,500 | $106,200 | $103,300 |
| 2018 | $3,572 | $209,500 | $106,200 | $103,300 |
| 2017 | $3,572 | $209,500 | $106,200 | $103,300 |
| 2016 | $3,512 | $206,700 | $102,100 | $104,600 |
| 2015 | $3,446 | $202,800 | $100,100 | $102,700 |
| 2014 | $836 | $202,800 | $100,100 | $102,700 |
Source: Public Records
Map
Nearby Homes
- 61 Clarence St
- 81 Laurence Dr
- 65 Verdugo St
- 19 Cora St
- 43 Wishing Well Way
- 16 North St
- 42 Janet St
- 74 Maple Terrace
- 42 Gregory Ln
- 147 Grandview Ave
- 260 Wolcott Ave
- 36 Maple Terrace
- 31 Stone Path Ln
- 180 Wolcott Ave
- 36 Shady Brook
- 86 Birnie Ave
- 32 Windpath E
- 34 High Meadow Dr
- 30 Chestnut St
- 514 Dewey St