Estimated Value: $848,463 - $1,024,000
5
Beds
6
Baths
5,077
Sq Ft
$190/Sq Ft
Est. Value
About This Home
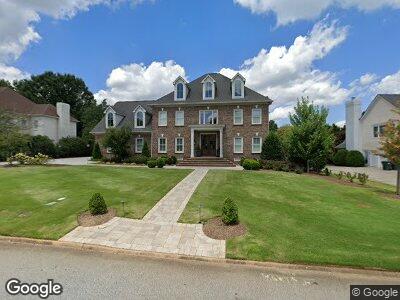
This home is located at 120 Belfrey Dr, Greer, SC 29650 and is currently estimated at $962,866, approximately $189 per square foot. 120 Belfrey Dr is a home located in Greenville County with nearby schools including Buena Vista Elementary School, Riverside Middle School, and Riverside High School.
Ownership History
Date
Name
Owned For
Owner Type
Purchase Details
Closed on
Feb 29, 2016
Sold by
Chen Wei and Xie Ning
Bought by
Magee Katja and Magee Ryan T
Current Estimated Value
Home Financials for this Owner
Home Financials are based on the most recent Mortgage that was taken out on this home.
Original Mortgage
$477,400
Interest Rate
3.79%
Mortgage Type
New Conventional
Purchase Details
Closed on
Nov 16, 2004
Sold by
Goorman Angela M
Bought by
Chen Wei
Purchase Details
Closed on
Apr 17, 2001
Sold by
Goorman Angela M
Bought by
Goorman Angela M
Purchase Details
Closed on
Jul 5, 2000
Sold by
Stephenson Harry S
Bought by
Gilleland Geoffrey T
Purchase Details
Closed on
Jun 29, 2000
Sold by
Briggs Paul
Bought by
Goorman Scott
Purchase Details
Closed on
Jan 15, 1999
Sold by
Price Arthur D
Bought by
Fleming Darlene K
Create a Home Valuation Report for This Property
The Home Valuation Report is an in-depth analysis detailing your home's value as well as a comparison with similar homes in the area
Home Values in the Area
Average Home Value in this Area
Purchase History
| Date | Buyer | Sale Price | Title Company |
|---|---|---|---|
| Magee Katja | $596,750 | None Available | |
| Chen Wei | $520,500 | -- | |
| Goorman Angela M | -- | -- | |
| Goorman Angela M | -- | -- | |
| Gilleland Geoffrey T | $325,000 | -- | |
| Goorman Scott | $499,900 | -- | |
| Fleming Darlene K | $11,000 | -- |
Source: Public Records
Mortgage History
| Date | Status | Borrower | Loan Amount |
|---|---|---|---|
| Open | Magee Ryan T | $300,000 | |
| Open | Magee Ryan T | $525,000 | |
| Closed | Magee Katja | $477,400 |
Source: Public Records
Tax History Compared to Growth
Tax History
| Year | Tax Paid | Tax Assessment Tax Assessment Total Assessment is a certain percentage of the fair market value that is determined by local assessors to be the total taxable value of land and additions on the property. | Land | Improvement |
|---|---|---|---|---|
| 2024 | $3,864 | $24,480 | $3,560 | $20,920 |
| 2023 | $3,864 | $24,480 | $3,560 | $20,920 |
| 2022 | $3,565 | $24,480 | $3,560 | $20,920 |
| 2021 | $3,568 | $24,480 | $3,560 | $20,920 |
| 2020 | $3,441 | $22,340 | $3,560 | $18,780 |
| 2019 | $3,372 | $22,340 | $3,560 | $18,780 |
| 2018 | $3,557 | $22,340 | $3,560 | $18,780 |
| 2017 | $3,523 | $22,340 | $3,560 | $18,780 |
| 2016 | $3,372 | $558,490 | $89,000 | $469,490 |
| 2015 | $3,327 | $558,490 | $89,000 | $469,490 |
| 2014 | $3,242 | $546,470 | $80,000 | $466,470 |
Source: Public Records
Map
Nearby Homes
- 332 Ascot Ridge Ln
- 105 Belfrey Dr
- 203 Barrington Park Dr
- 3 Treyburn Ct
- 505 Sugar Mill Rd
- 106 Plum Mill Ct
- 20 Pristine Dr
- 111 Farm Valley Ct
- 108 Tarleton Way
- 102 Sugar Mill Way
- 708 Sugar Mill Rd
- 108 Hancock Ln
- 223 E Shallowstone Rd
- 1 Rugosa Way
- 431 Clare Bank Dr
- 604 Glassyrock Ct
- 110 Saratoga Dr
- 35 Cedar Rock Dr
- 213 Bell Heather Ln
- 207 Bell Heather Ln
- 120 Belfrey Dr
- 200 Belfrey Dr
- 116 Belfrey Dr
- 318 Ascot Ridge Ln
- 316 Ascot Ridge Ln
- 320 Ascot Ridge Ln
- 314 Ascot Ridge Ln
- 204 Belfrey Dr
- 112 Belfrey Dr
- 322 Ascot Ridge Ln
- 312 Ascot Ridge Ln
- 201 Belfrey Dr
- 324 Ascot Ridge Ln
- 205 Belfrey Dr
- 326 Ascot Ridge Ln
- 108 Belfrey Dr
- 300 Belfrey Dr
- 113 Belfrey Dr
- 310 Ascot Ridge Ln
- 315 Ascot Ridge Ln