J
Landlord's Agent in 2025
Jackson Handmacher
Jackson Rents Atlanta, LLC.
(404) 754-1036
16 Total Sales
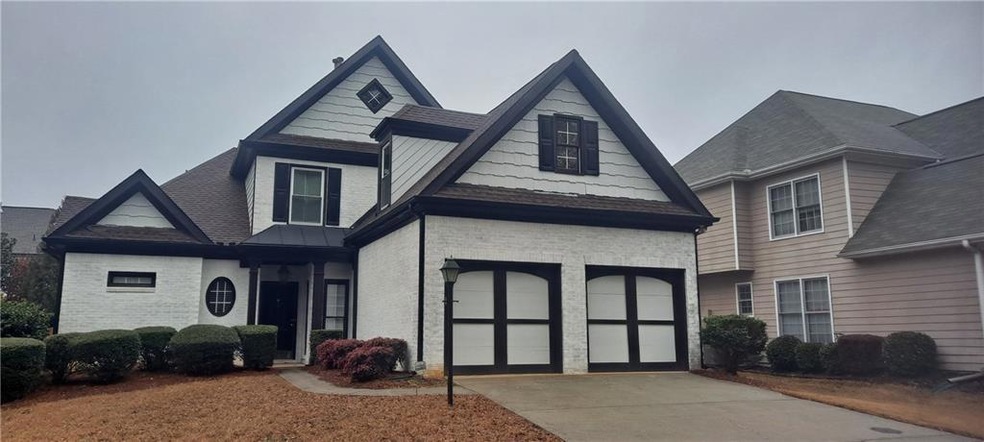
COME HOME TO LUXURY IN THIS FABULOUS CUL DE SAC PROPERTY. Kitchen has stainless steel appliances and granite countertops. Walk in pantry. Keeping room with fireplace. Soaring living room ceiling with tons of light. Formal dining room. Master on main with huge closet, luxurious ensuite bathroom. Upstairs find 4 more bedrooms, one is above the garage and has vinyl flooring. Fenced back yard. Minutes from North Point Parkway. Currently pending as lease has been signed.
Last Agent to Rent the Property
Jackson Rents Atlanta, LLC. License #292924 Listed on: 02/06/2025
Last Renter's Agent
Jackson Rents Atlanta, LLC. License #292924 Listed on: 02/06/2025
| Date | Buyer | Sale Price | Title Company |
|---|---|---|---|
| Agnihotri Sharad | $285,000 | -- | |
| Hewett Kathy A | $221,700 | -- |
| Date | Status | Borrower | Loan Amount |
|---|---|---|---|
| Open | Agnihotri Sharad | $242,250 | |
| Previous Owner | Hewett Kathy A | $170,000 |
| Date | Event | Price | List to Sale | Price per Sq Ft | Prior Sale |
|---|---|---|---|---|---|
| 03/01/2025 03/01/25 | Rented | $3,300 | -5.7% | -- | |
| 02/06/2025 02/06/25 | Under Contract | -- | -- | -- | |
| 02/06/2025 02/06/25 | For Rent | $3,500 | -5.4% | -- | |
| 07/22/2024 07/22/24 | Rented | $3,700 | 0.0% | -- | |
| 07/09/2024 07/09/24 | Under Contract | -- | -- | -- | |
| 07/02/2024 07/02/24 | For Rent | $3,700 | +8.8% | -- | |
| 03/01/2023 03/01/23 | Rented | $3,400 | 0.0% | -- | |
| 02/09/2023 02/09/23 | Under Contract | -- | -- | -- | |
| 01/23/2023 01/23/23 | Price Changed | $3,400 | -2.9% | $1 / Sq Ft | |
| 12/29/2022 12/29/22 | For Rent | $3,500 | +2.9% | -- | |
| 12/29/2021 12/29/21 | Rented | $3,400 | 0.0% | -- | |
| 12/14/2021 12/14/21 | Under Contract | -- | -- | -- | |
| 12/06/2021 12/06/21 | For Rent | $3,400 | +36.0% | -- | |
| 05/22/2018 05/22/18 | Rented | $2,500 | 0.0% | -- | |
| 05/07/2018 05/07/18 | For Rent | $2,500 | 0.0% | -- | |
| 07/18/2013 07/18/13 | Sold | $285,000 | -1.7% | $96 / Sq Ft | View Prior Sale |
| 05/24/2013 05/24/13 | Pending | -- | -- | -- | |
| 05/15/2013 05/15/13 | For Sale | $289,900 | -- | $97 / Sq Ft |
| Year | Tax Paid | Tax Assessment Tax Assessment Total Assessment is a certain percentage of the fair market value that is determined by local assessors to be the total taxable value of land and additions on the property. | Land | Improvement |
|---|---|---|---|---|
| 2025 | $943 | $163,960 | $27,840 | $136,120 |
| 2023 | $943 | $163,960 | $27,840 | $136,120 |
| 2022 | $3,797 | $144,320 | $35,400 | $108,920 |
| 2021 | $2,807 | $123,480 | $30,080 | $93,400 |
| 2020 | $2,820 | $122,000 | $29,720 | $92,280 |
| 2019 | $392 | $119,880 | $29,200 | $90,680 |
| 2018 | $2,741 | $117,080 | $28,520 | $88,560 |
| 2017 | $2,392 | $94,280 | $25,840 | $68,440 |
| 2016 | $2,378 | $94,280 | $25,840 | $68,440 |
| 2015 | $2,729 | $94,280 | $25,840 | $68,440 |
| 2014 | $2,385 | $90,560 | $22,560 | $68,000 |
J
Landlord's Agent in 2025
Jackson Handmacher
Jackson Rents Atlanta, LLC.
(404) 754-1036
16 Total Sales

Seller's Agent in 2024
AYELET GILAD
Keller Williams Rlty, First Atlanta
(678) 609-8588
7 in this area
87 Total Sales
Buyer's Agent in 2024
Jaya Choudhary
Atlanta Communities
(404) 542-5292
22 in this area
102 Total Sales
Seller's Agent in 2018
Moriya Jackson
Atlanta Fine Homes Sotheby's International Realty
(404) 451-2003
1 in this area
24 Total Sales
N
Buyer's Agent in 2018
Nancy Murphy
NOT A VALID MEMBER
Seller's Agent in 2013
Art Worley
HomeSmart
(678) 596-8911
2 in this area
20 Total Sales
Source: First Multiple Listing Service (FMLS)
MLS Number: 7520585
APN: 11-0040-0007-261-0
Disclaimer: Certain information contained herein is derived from information provided by parties other than Homes.com. All information provided is deemed reliable, but is not guaranteed to be accurate and should be independently verified.
![]() Listings identified with the FMLS IDX logo come from FMLS and are held by brokerage firms other than the owner of this website. The listing brokerage is identified in any listing details. Information is deemed reliable but is not guaranteed. If you believe any FMLS listing contains material that infringes your copyrighted work please visit www.fmls.com/dmca to review our DMCA policy and learn how to submit a takedown request. © 2025 First Multiple Listing Service, Inc.
Listings identified with the FMLS IDX logo come from FMLS and are held by brokerage firms other than the owner of this website. The listing brokerage is identified in any listing details. Information is deemed reliable but is not guaranteed. If you believe any FMLS listing contains material that infringes your copyrighted work please visit www.fmls.com/dmca to review our DMCA policy and learn how to submit a takedown request. © 2025 First Multiple Listing Service, Inc.