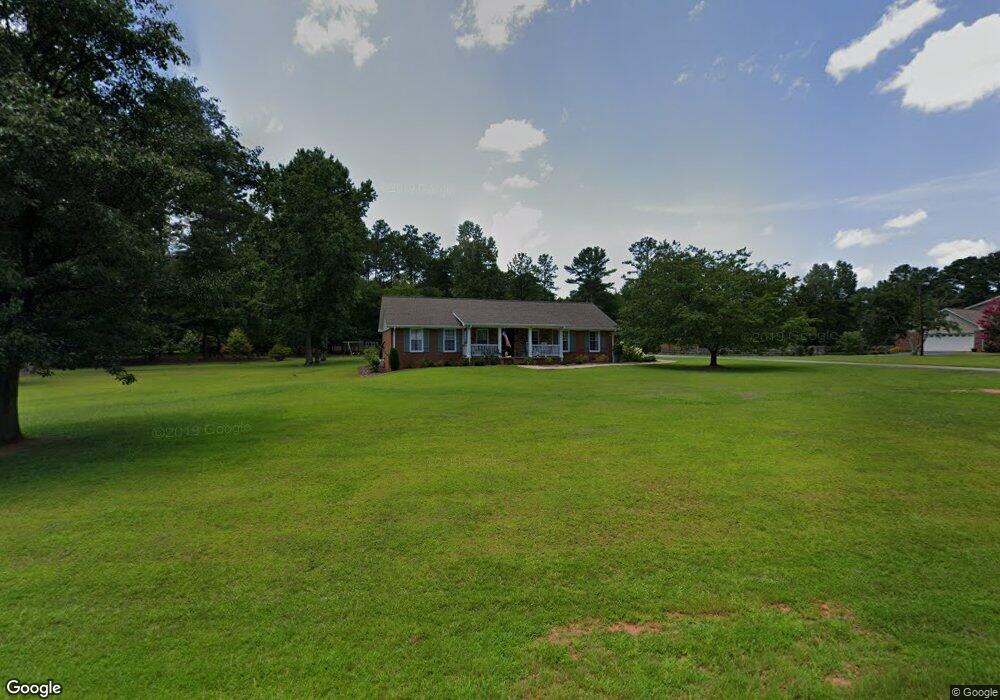
120 Cannongate Cir Unit 1 Sharpsburg, GA 30277
Estimated Value: $360,598 - $408,000
3
Beds
2
Baths
1,944
Sq Ft
$202/Sq Ft
Est. Value
About This Home
This home is located at 120 Cannongate Cir Unit 1, Sharpsburg, GA 30277 and is currently estimated at $392,150, approximately $201 per square foot. 120 Cannongate Cir Unit 1 is a home located in Coweta County with nearby schools including Canongate Elementary School, Madras Middle School, and Northgate High School.
Ownership History
Date
Name
Owned For
Owner Type
Purchase Details
Closed on
May 17, 2013
Sold by
Federal Home Loan Mortgage Corporation
Bought by
Lethbridge Mark and Lethbridge Linda
Current Estimated Value
Purchase Details
Closed on
Apr 5, 2005
Sold by
Ratiff Richard W and Ratiff Kathleen
Bought by
Love Donald
Home Financials for this Owner
Home Financials are based on the most recent Mortgage that was taken out on this home.
Original Mortgage
$187,150
Interest Rate
5.98%
Mortgage Type
New Conventional
Purchase Details
Closed on
Jan 7, 2005
Sold by
Higgins John
Bought by
Richardson Carey J and Richardson Amanda
Home Financials for this Owner
Home Financials are based on the most recent Mortgage that was taken out on this home.
Original Mortgage
$127,200
Interest Rate
5.63%
Mortgage Type
New Conventional
Purchase Details
Closed on
Mar 30, 2000
Sold by
Tovar Mark A and Tovar Sandra G
Bought by
Higgins John
Purchase Details
Closed on
Mar 31, 1981
Bought by
Tovar Mark A and Tovar Sandr
Create a Home Valuation Report for This Property
The Home Valuation Report is an in-depth analysis detailing your home's value as well as a comparison with similar homes in the area
Home Values in the Area
Average Home Value in this Area
Purchase History
| Date | Buyer | Sale Price | Title Company |
|---|---|---|---|
| Lethbridge Mark | $150,400 | -- | |
| Love Donald | $197,000 | -- | |
| Richardson Carey J | $159,000 | -- | |
| Higgins John | $122,500 | -- | |
| Tovar Mark A | -- | -- |
Source: Public Records
Mortgage History
| Date | Status | Borrower | Loan Amount |
|---|---|---|---|
| Previous Owner | Love Donald | $187,150 | |
| Previous Owner | Richardson Carey J | $127,200 |
Source: Public Records
Tax History Compared to Growth
Tax History
| Year | Tax Paid | Tax Assessment Tax Assessment Total Assessment is a certain percentage of the fair market value that is determined by local assessors to be the total taxable value of land and additions on the property. | Land | Improvement |
|---|---|---|---|---|
| 2025 | $2,808 | $125,528 | $30,000 | $95,528 |
| 2024 | $2,688 | $120,408 | $22,800 | $97,608 |
| 2023 | $2,688 | $127,378 | $22,800 | $104,578 |
| 2022 | $2,158 | $92,320 | $16,000 | $76,320 |
| 2021 | $1,996 | $80,505 | $16,000 | $64,505 |
| 2020 | $1,943 | $91,800 | $16,000 | $75,800 |
| 2019 | $1,790 | $65,970 | $8,000 | $57,970 |
| 2018 | $1,794 | $65,970 | $8,000 | $57,970 |
| 2017 | $1,553 | $57,758 | $8,000 | $49,758 |
| 2016 | $1,536 | $57,758 | $8,000 | $49,758 |
| 2015 | $1,472 | $56,308 | $8,000 | $48,308 |
| 2014 | $1,463 | $56,308 | $8,000 | $48,308 |
Source: Public Records
Map
Nearby Homes
- 125 Cannongate Cir
- 131 Cannongate Cir
- 319 Beaconsfield Dr
- 12 Race Point Way
- 259 Strathmore Dr Unit 3
- 2043 Fischer Rd
- 2039 Fischer Rd
- 95 Tyler Woods Dr
- 10 Monteray Ct
- 10 Fisher Way
- 972 Raymond Hill Rd
- 68 Timbercreek Estates
- 68 Timbercreek Estates Dr
- 40 Wenham Ln
- 75 Tomahawk Dr
- 70 N Strathmore Dr
- 851 Raymond Hill Rd
- 319 Le Paradis Blvd
- 20 Skipton Ct
- 0 Maple Trail
- 114 Cannongate Cir
- 128 Cannongate Cir
- 117 Cannongate Cir
- 140 Cannongate Cir
- 134 Cannongate Cir
- 119 Cannongate Cir
- 127 Cannongate Cir
- 113 Cannongate Cir
- 121 Cannongate Cir
- 110 Cannongate Cir
- 129A Cannongate Cir
- 129 Cannongate Cir
- 129 Cannongate Cir Unit A
- 123 Cannongate Cir
- 139 Cannongate Cir
- 201 Beaconsfield Dr Unit 1
- 211 Beaconsfield Dr
- 111 Cannongate Cir
- 185 Beaconsfield Dr Unit 1
- 225 Beaconsfield Dr