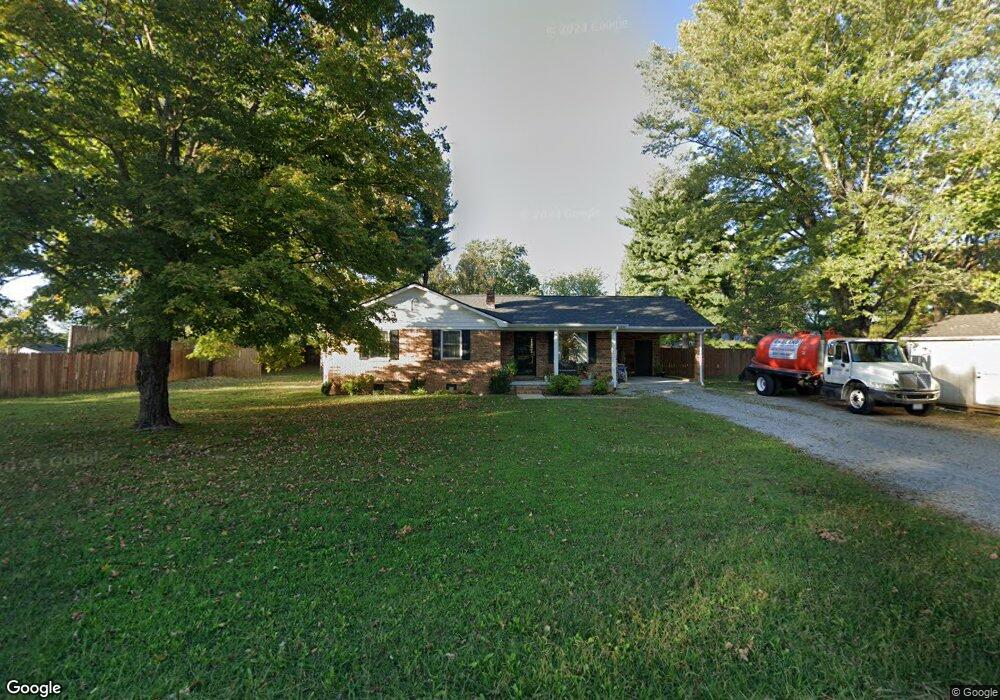
120 Chilcut Rd Cookeville, TN 38506
Estimated Value: $202,962 - $298,000
3
Beds
1
Bath
1,350
Sq Ft
$191/Sq Ft
Est. Value
About This Home
This home is located at 120 Chilcut Rd, Cookeville, TN 38506 and is currently estimated at $257,741, approximately $190 per square foot. 120 Chilcut Rd is a home located in Putnam County with nearby schools including Algood Middle School, Algood Elementary School, and Cookeville High School.
Ownership History
Date
Name
Owned For
Owner Type
Purchase Details
Closed on
Feb 22, 2017
Sold by
England Tammy
Bought by
Gore Tammy
Current Estimated Value
Purchase Details
Closed on
May 11, 2012
Sold by
England Randy
Bought by
England Tammy
Purchase Details
Closed on
May 10, 2004
Sold by
Fowler Jack L and Fowler Nancy
Bought by
Randy England and Randy Tammy
Home Financials for this Owner
Home Financials are based on the most recent Mortgage that was taken out on this home.
Original Mortgage
$75,326
Interest Rate
5.77%
Purchase Details
Closed on
Sep 14, 1992
Bought by
Fowler Jack L and Fowler Nancy
Purchase Details
Closed on
Dec 5, 1989
Bought by
Dunn Jeffrey B Sandra
Purchase Details
Closed on
Jun 17, 1987
Bought by
Mcneal Harvey & Third Natl Mort Co
Purchase Details
Closed on
Oct 5, 1982
Bought by
Boles James T and Boles Sherri L
Create a Home Valuation Report for This Property
The Home Valuation Report is an in-depth analysis detailing your home's value as well as a comparison with similar homes in the area
Home Values in the Area
Average Home Value in this Area
Purchase History
| Date | Buyer | Sale Price | Title Company |
|---|---|---|---|
| Gore Tammy | -- | -- | |
| England Tammy | -- | -- | |
| Randy England | $77,000 | -- | |
| Fowler Jack L | $53,500 | -- | |
| Dunn Jeffrey B Sandra | $55,000 | -- | |
| Mcneal Harvey & Third Natl Mort Co | $42,500 | -- | |
| Boles James T | -- | -- |
Source: Public Records
Mortgage History
| Date | Status | Borrower | Loan Amount |
|---|---|---|---|
| Previous Owner | Boles James T | $75,326 |
Source: Public Records
Tax History Compared to Growth
Tax History
| Year | Tax Paid | Tax Assessment Tax Assessment Total Assessment is a certain percentage of the fair market value that is determined by local assessors to be the total taxable value of land and additions on the property. | Land | Improvement |
|---|---|---|---|---|
| 2024 | $859 | $32,300 | $2,875 | $29,425 |
| 2023 | $859 | $32,300 | $2,875 | $29,425 |
| 2022 | $798 | $32,300 | $2,875 | $29,425 |
| 2021 | $915 | $32,300 | $2,875 | $29,425 |
| 2020 | $644 | $32,300 | $2,875 | $29,425 |
| 2019 | $741 | $22,000 | $2,875 | $19,125 |
| 2018 | $709 | $22,000 | $2,875 | $19,125 |
| 2017 | $709 | $22,000 | $2,875 | $19,125 |
| 2016 | $714 | $22,000 | $2,875 | $19,125 |
| 2015 | $730 | $22,000 | $2,875 | $19,125 |
| 2014 | $725 | $21,857 | $0 | $0 |
Source: Public Records
Map
Nearby Homes
- 185 Mirandy Rd
- 469 E Main St
- 250 E Main St
- 250 E Main East St
- 340 2nd Ave N
- 153 Mccauley St
- 262 McCawley St
- 3124 Dogwood Ln
- 164 W Wall St
- 136 Phillips Bend Ct
- 3354 Dogwood Ln
- 88 Quinland Lake Rd
- 146 Dry Valley Rd
- 389 4th Ave N
- 251 Haven Ln
- 3930 Olyvia Ct
- 000 Mirandy Rd
- 152 Lane Ave
- 3485 Officers Chapel Rd