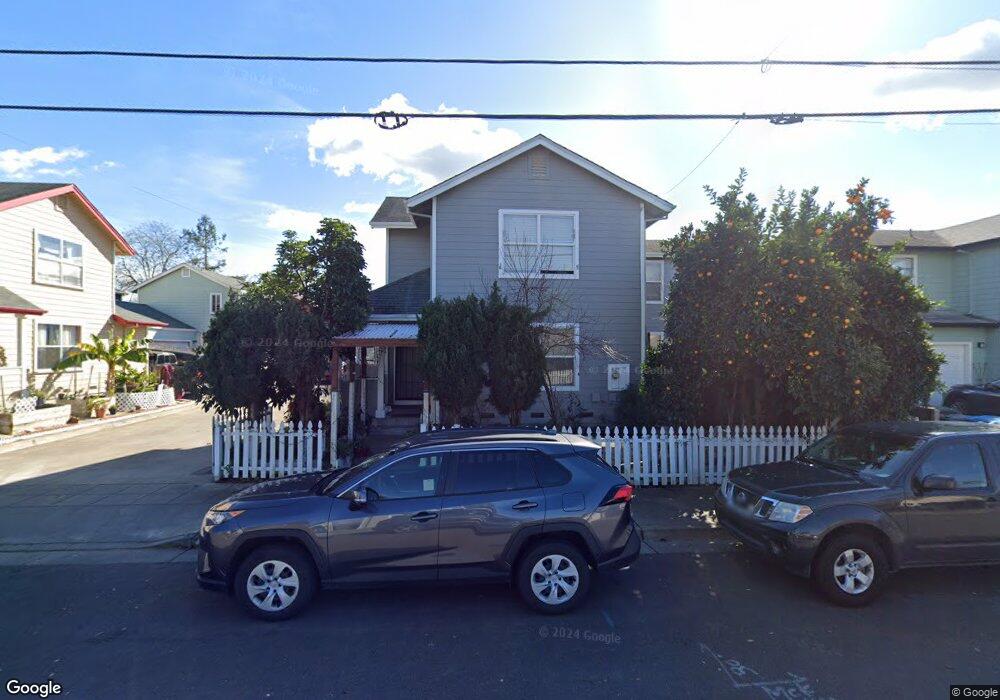
120 Decker St Santa Rosa, CA 95401
Historic Railroad Square NeighborhoodEstimated Value: $541,000 - $596,000
4
Beds
2
Baths
1,427
Sq Ft
$405/Sq Ft
Est. Value
About This Home
This home is located at 120 Decker St, Santa Rosa, CA 95401 and is currently estimated at $577,326, approximately $404 per square foot. 120 Decker St is a home located in Sonoma County with nearby schools including Abraham Lincoln Elementary School, Santa Rosa Middle School, and Santa Rosa High School.
Ownership History
Date
Name
Owned For
Owner Type
Purchase Details
Closed on
May 7, 1999
Sold by
Burbank Housing Development Corp
Bought by
Tewolde Fessehaye and Gebremichael Luchia
Current Estimated Value
Home Financials for this Owner
Home Financials are based on the most recent Mortgage that was taken out on this home.
Original Mortgage
$108,872
Outstanding Balance
$27,711
Interest Rate
6.86%
Mortgage Type
FHA
Estimated Equity
$549,615
Create a Home Valuation Report for This Property
The Home Valuation Report is an in-depth analysis detailing your home's value as well as a comparison with similar homes in the area
Home Values in the Area
Average Home Value in this Area
Purchase History
| Date | Buyer | Sale Price | Title Company |
|---|---|---|---|
| Tewolde Fessehaye | $152,000 | North American Title Co |
Source: Public Records
Mortgage History
| Date | Status | Borrower | Loan Amount |
|---|---|---|---|
| Open | Tewolde Fessehaye | $108,872 | |
| Closed | Tewolde Fessehaye | $36,500 |
Source: Public Records
Tax History
| Year | Tax Paid | Tax Assessment Tax Assessment Total Assessment is a certain percentage of the fair market value that is determined by local assessors to be the total taxable value of land and additions on the property. | Land | Improvement |
|---|---|---|---|---|
| 2025 | $2,706 | $238,275 | $94,053 | $144,222 |
| 2024 | $2,706 | $233,604 | $92,209 | $141,395 |
| 2023 | $2,706 | $229,024 | $90,401 | $138,623 |
| 2022 | $2,500 | $224,534 | $88,629 | $135,905 |
| 2021 | $2,470 | $220,133 | $86,892 | $133,241 |
| 2020 | $2,465 | $217,877 | $86,002 | $131,875 |
| 2019 | $2,452 | $213,606 | $84,316 | $129,290 |
| 2018 | $2,439 | $209,418 | $82,663 | $126,755 |
| 2017 | $2,396 | $205,313 | $81,043 | $124,270 |
| 2016 | $2,372 | $201,288 | $79,454 | $121,834 |
| 2015 | $2,301 | $198,265 | $78,261 | $120,004 |
| 2014 | $2,161 | $194,382 | $76,728 | $117,654 |
Source: Public Records
Map
Nearby Homes
- 303 Boyce St
- 1035 Maxwell Dr
- 158 N Dutton Ave Unit 4
- 930 Morgan St Unit 3
- 595 N Dutton Ave
- 611 Willrush St
- 1127 Cleveland Ave
- 220 Carrillo St
- 547 B St
- 432 8th St
- 100 Ridgway Ave
- 312 Benton St
- 786 Simpson Place
- 1239 Eardley Ave
- 107 Sebastopol Ave
- 418 Humboldt St
- 705 College Ave
- 810 7th St Unit 24
- 713 Blair Place
- 717 Blair Place
Your Personal Tour Guide
Ask me questions while you tour the home.