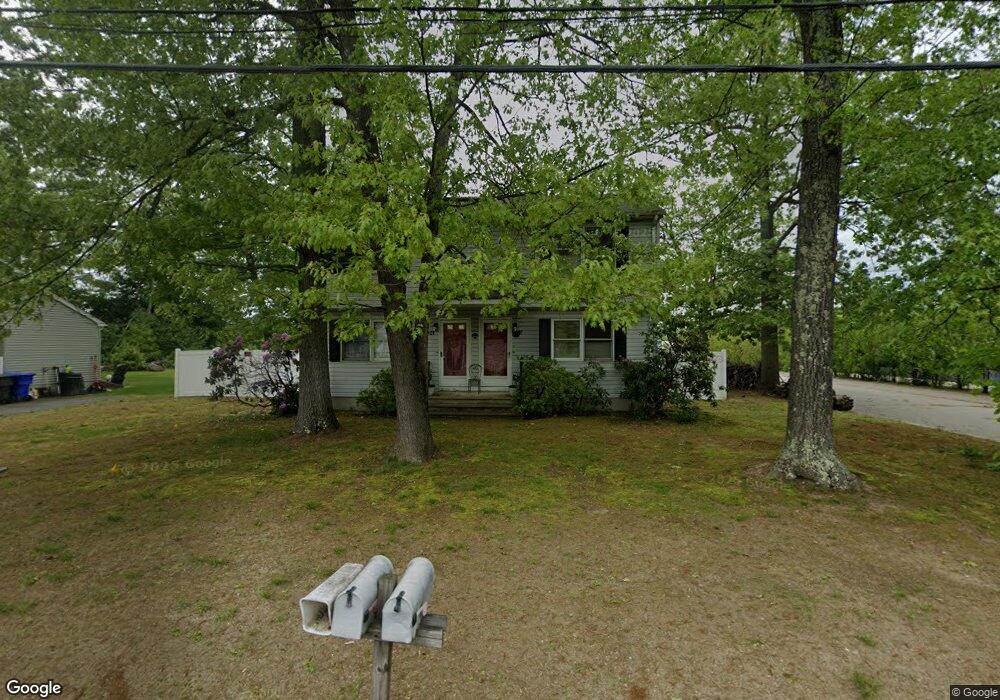
120 Fargo St Unit 122 Springfield, MA 01119
Pine Point NeighborhoodEstimated Value: $398,000 - $501,000
4
Beds
4
Baths
1,944
Sq Ft
$221/Sq Ft
Est. Value
About This Home
This home is located at 120 Fargo St Unit 122, Springfield, MA 01119 and is currently estimated at $429,812, approximately $221 per square foot. 120 Fargo St Unit 122 is a home located in Hampden County with nearby schools including Thomas M Balliet Elementary School, John J Duggan Middle, and Springfield Central High School.
Ownership History
Date
Name
Owned For
Owner Type
Purchase Details
Closed on
Oct 26, 1999
Sold by
Bousquet Paul A and Mazzella Richard J
Bought by
Thomas Cynthia D
Current Estimated Value
Home Financials for this Owner
Home Financials are based on the most recent Mortgage that was taken out on this home.
Original Mortgage
$109,100
Interest Rate
7.83%
Mortgage Type
Purchase Money Mortgage
Create a Home Valuation Report for This Property
The Home Valuation Report is an in-depth analysis detailing your home's value as well as a comparison with similar homes in the area
Home Values in the Area
Average Home Value in this Area
Purchase History
| Date | Buyer | Sale Price | Title Company |
|---|---|---|---|
| Thomas Cynthia D | $110,000 | -- |
Source: Public Records
Mortgage History
| Date | Status | Borrower | Loan Amount |
|---|---|---|---|
| Open | Thomas Cynthia D | $107,909 | |
| Closed | Thomas Cynthia D | $109,100 |
Source: Public Records
Tax History Compared to Growth
Tax History
| Year | Tax Paid | Tax Assessment Tax Assessment Total Assessment is a certain percentage of the fair market value that is determined by local assessors to be the total taxable value of land and additions on the property. | Land | Improvement |
|---|---|---|---|---|
| 2025 | $6,005 | $383,000 | $40,200 | $342,800 |
| 2024 | $5,430 | $338,100 | $40,200 | $297,900 |
| 2023 | $5,495 | $322,300 | $35,600 | $286,700 |
| 2022 | $4,882 | $259,400 | $33,200 | $226,200 |
| 2021 | $4,559 | $241,200 | $30,200 | $211,000 |
| 2020 | $4,416 | $226,100 | $30,200 | $195,900 |
| 2019 | $3,962 | $201,300 | $31,300 | $170,000 |
| 2018 | $3,847 | $195,500 | $31,300 | $164,200 |
| 2017 | $3,702 | $188,300 | $34,500 | $153,800 |
| 2016 | $3,574 | $181,800 | $34,500 | $147,300 |
| 2015 | $3,497 | $177,800 | $34,500 | $143,300 |
Source: Public Records
Map
Nearby Homes