120 Fiser Rd Waverly, TN 37185
Estimated payment $5,257/month
Highlights
- Barn
- 80.1 Acre Lot
- Private Lot
- Home fronts a creek
- Open Floorplan
- Wooded Lot
About This Home
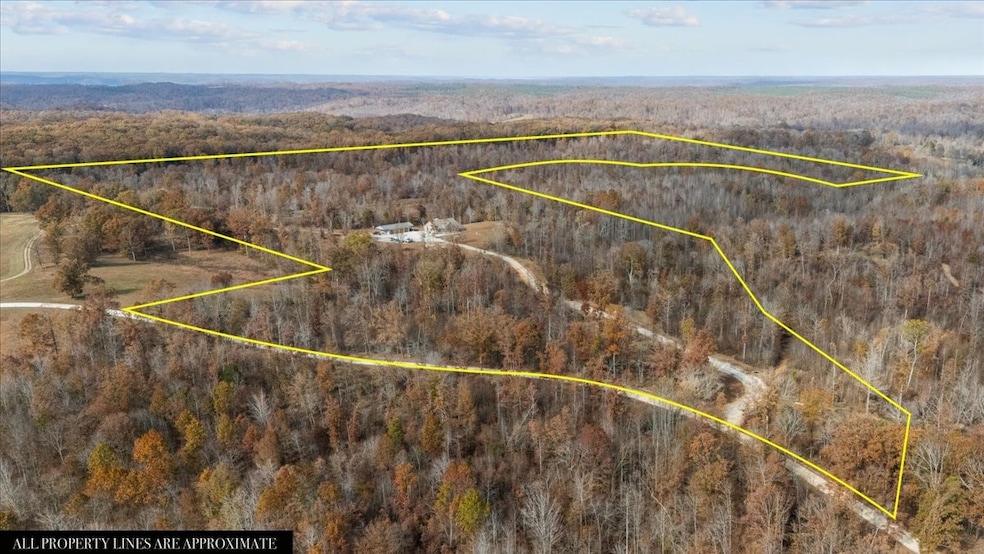
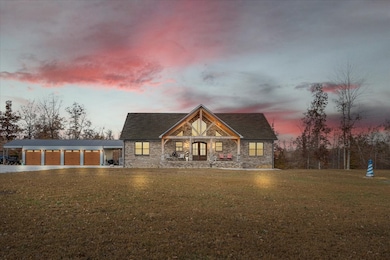
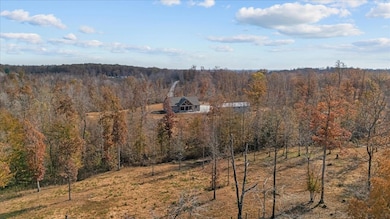
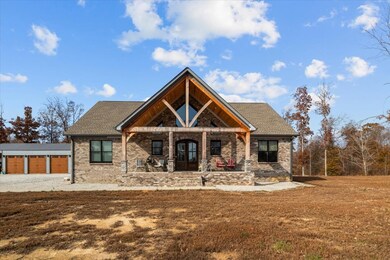
Discover 80.1 unrestricted acres of beautiful, rolling Tennessee landscape featuring a stunning custom brick home set privately and centrally on the property. This 3 BD, 2 BA home blends comfort, craftsmanship, and natural beauty—an ideal retreat for outdoor lovers, families, or those looking for peaceful country living.
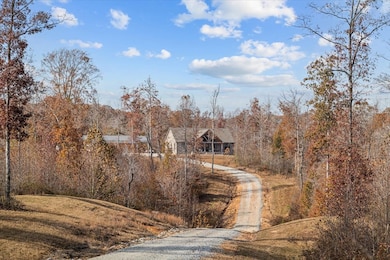
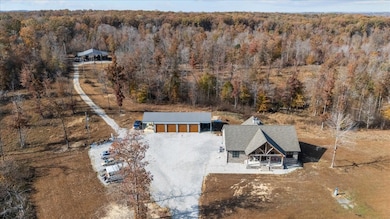
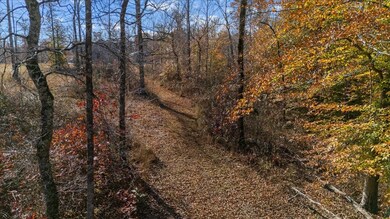
The property is a hunter’s paradise, home to abundant whitetail deer and turkey. 2 creeks meander through the property and provide sustainability for all wildlife in the surrounding area! A trail system runs throughout the acreage, providing easy access to all parts of the property—perfect for riding, hiking, managing livestock, or reaching hunting stands or food plots. Inside, the home showcases oak hardwood flooring, a lovely bamboo kitchen sink, and a spacious quartz island accented by uniquely and beautifully designed lighting above. A gorgeous stone, wood-burning fireplace serves as the heart of the home, creating a warm and inviting gathering space. Large windows fill the interior with natural light and offer serene views of the surrounding land. Additional features include: 4-bay detached garage—insulated, heated and cooled, plumbed for a full bath with a 200 AMP electric service, full RV hookup with septic and 50 AMP electric service, 60x64 pole barn with 200 AMP electric service on location, a well, and a
small livestock barn with fencing. Multiple building sites and potential pond locations across the acreage Located just minutes from the TN River and Turkey Creek Marina, with its public boat ramp, white sandy beach, restaurant, and summertime live music, this property offers the perfect blend of seclusion and convenience. Enjoy an evening ride on your side-by-side for dinner on the water and warm summer nights by the river! This exceptional property offers endless possibilities: private estate, recreational retreat, homestead, or family compound. Rare opportunity to own a breathtaking piece of unrestricted Tennessee countryside.
Listing Agent
Tennessee Property Group Brokerage Phone: 9312090595 License #353999 Listed on: 11/23/2025
Home Details
Home Type
- Single Family
Est. Annual Taxes
- $3,072
Year Built
- Built in 2023
Lot Details
- 80.1 Acre Lot
- Home fronts a creek
- Partially Fenced Property
- Private Lot
- Level Lot
- Cleared Lot
- Wooded Lot
Parking
- 4 Car Garage
- 12 Open Parking Spaces
- Garage Door Opener
- Driveway
Home Design
- Brick Exterior Construction
- Stone Siding
Interior Spaces
- 2,498 Sq Ft Home
- Property has 1 Level
- Open Floorplan
- High Ceiling
- Ceiling Fan
- Great Room with Fireplace
- Combination Dining and Living Room
- Utility Room
- Wood Flooring
- Valley Views
- Crawl Space
Kitchen
- Built-In Electric Oven
- Cooktop
- Microwave
- Dishwasher
- Stainless Steel Appliances
- Kitchen Island
Bedrooms and Bathrooms
- 3 Main Level Bedrooms
- Walk-In Closet
- 2 Full Bathrooms
Laundry
- Dryer
- Washer
Schools
- Waverly Elementary School
- Waverly Jr High Middle School
- Waverly Central High School
Utilities
- Forced Air Heating and Cooling System
- Floor Furnace
- Heating System Uses Propane
- Well
- Septic Tank
- High Speed Internet
Additional Features
- Covered Patio or Porch
- Barn
Community Details
- No Home Owners Association
Listing and Financial Details
- Assessor Parcel Number 015 00801 000
Map
Home Values in the Area
Average Home Value in this Area
Tax History
| Year | Tax Paid | Tax Assessment Tax Assessment Total Assessment is a certain percentage of the fair market value that is determined by local assessors to be the total taxable value of land and additions on the property. | Land | Improvement |
|---|---|---|---|---|
| 2025 | $3,072 | $166,950 | $0 | $0 |
| 2024 | $3,072 | $166,950 | $13,275 | $153,675 |
| 2023 | $196 | $166,950 | $13,275 | $153,675 |
| 2022 | $197 | $9,025 | $9,025 | $0 |
| 2021 | $197 | $9,025 | $9,025 | $0 |
| 2020 | $709 | $9,025 | $9,025 | $0 |
| 2019 | $369 | $27,300 | $27,300 | $0 |
| 2018 | $369 | $18,175 | $18,175 | $0 |
| 2017 | $513 | $21,275 | $21,275 | $0 |
| 2016 | $459 | $20,875 | $20,875 | $0 |
| 2015 | $459 | $20,875 | $20,875 | $0 |
| 2014 | $459 | $20,869 | $0 | $0 |
Property History
| Date | Event | Price | List to Sale | Price per Sq Ft |
|---|---|---|---|---|
| 11/23/2025 11/23/25 | For Sale | $949,900 | -- | $380 / Sq Ft |
Purchase History
| Date | Type | Sale Price | Title Company |
|---|---|---|---|
| Interfamily Deed Transfer | -- | None Available | |
| Quit Claim Deed | -- | None Available | |
| Warranty Deed | $140,000 | None Available | |
| Warranty Deed | $46,000 | None Available | |
| Warranty Deed | $30,000 | -- | |
| Warranty Deed | $465,000 | -- | |
| Deed | $62,250 | -- | |
| Warranty Deed | $62,300 | -- | |
| Warranty Deed | $13,200 | -- | |
| Deed | -- | -- |
Source: Realtracs
MLS Number: 3049998
APN: 015-008.01
Disclaimer: Certain information contained herein is derived from information provided by parties other than Homes.com. All information provided is deemed reliable, but is not guaranteed to be accurate and should be independently verified.
![]() Based on information submitted to the MLS GRID. All data is obtained from various sources and may not have been verified by broker or MLS GRID. Supplied Open House Information is subject to change without notice. All information should be independently reviewed and verified for accuracy. Properties may or may not be listed by the office/agent presenting the information. Some IDX listings have been excluded from this website.
Based on information submitted to the MLS GRID. All data is obtained from various sources and may not have been verified by broker or MLS GRID. Supplied Open House Information is subject to change without notice. All information should be independently reviewed and verified for accuracy. Properties may or may not be listed by the office/agent presenting the information. Some IDX listings have been excluded from this website.
The Digital Millennium Copyright Act of 1998, 17 U.S.C. § 512 (the “DMCA”) provides recourse for copyright owners who believe that material appearing on the Internet infringes their rights under U.S. copyright law. If you believe in good faith that any content or material made available in connection with our website or services infringes your copyright, you (or your agent) may send us a notice requesting that the content or material be removed, or access to it blocked.
Notices must be sent in writing by email to DMCAnotice@MLSGrid.com.
The DMCA requires that your notice of alleged copyright infringement include the following information:
(1) description of the copyrighted work that is the subject of claimed infringement;
(2) description of the alleged infringing content and information sufficient to permit us to locate the content;
(3) contact information for you, including your address, telephone number and email address;
(4) a statement by you that you have a good faith belief that the content in the manner complained of is not authorized by the copyright owner, or its agent, or by the operation of any law;
(5) a statement by you, signed under penalty of perjury, that the information in the notification is accurate and that you have the authority to enforce the copyrights that are claimed to be infringed; and
(6) a physical or electronic signature of the copyright owner or a person authorized to act on the copyright owner’s behalf. Failure to include all of the above information may result in the delay of the processing of your complaint.
- 102 Highwater Rd
- 0 Halls Creek Rd Unit RTC2969953
- 4040 Jack Saunders Rd
- 0 Jack Saunders Rd
- 0 Tug Dr Unit RTC2622931
- 0 Sykes Branch Rd
- 9828 Clydeton Rd
- 9740 Clydeton Rd
- 135 Haylee Rd
- 0 Overview Dr Unit RTC3039351
- 59 Riverview Ln
- 0 Briarfield Ct Unit RTC2808778
- 0 Riverview Ln
- 97 Camp Cir
- 0 Highwater Rd Unit RTC2882956
- 0 Highwater Rd Unit RTC2662077
- 0 Highwater Rd Unit RTC2647801
- 0 Highwater Rd Unit RTC2944123
- 0 Highwater Rd Unit RTC2640973
- 0 Highwater Rd Unit RTC2640981
- 0 Acorn Village Ln
- 204 S Clydeton Rd Unit E 1-8
- 542 Ashe Ave Unit 2
- 542 Ashe Ave Unit 7
- 218 Mike St
- 118 Stigall St
- 174 Schools Dr
- 114 Hickory Hill Dr
- 704 Donelson Pkwy Unit D107
- 704 Donelson Pkwy Unit A200
- 704 Donelson Pkwy Unit A201
- 704 Donelson Pkwy Unit C205
- 704 Donelson Pkwy Unit B202
- 112 Colson Rd
- 104 Colson Rd
- 108 Colson Rd
- 110 Colson Rd
- 102 Colson Rd
- 106 Colson Rd
- 200-202 3rd St Unit 200
