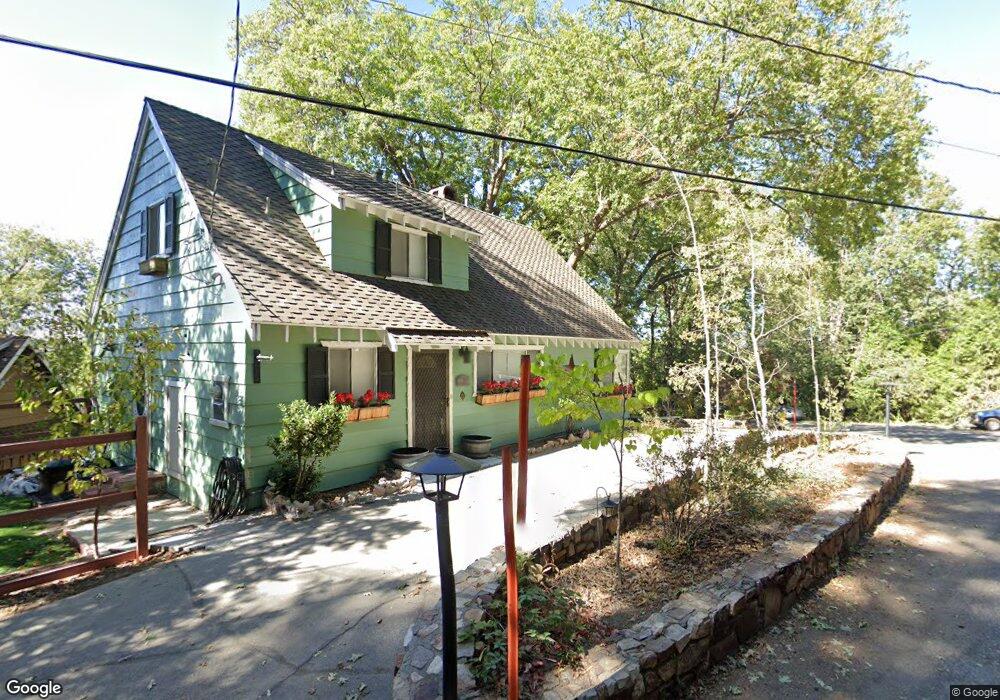
120 Fremont Rd Lake Arrowhead, CA 92352
Estimated Value: $487,820 - $547,000
3
Beds
2
Baths
1,969
Sq Ft
$268/Sq Ft
Est. Value
About This Home
This home is located at 120 Fremont Rd, Lake Arrowhead, CA 92352 and is currently estimated at $527,955, approximately $268 per square foot. 120 Fremont Rd is a home located in San Bernardino County with nearby schools including Lake Arrowhead Elementary School, Mary P. Henck Intermediate School, and Rim Of The World Senior High School.
Ownership History
Date
Name
Owned For
Owner Type
Purchase Details
Closed on
May 18, 2012
Sold by
Haus Jonathan R and Haus Kathleen M
Bought by
Haus Jon and Haus Kathy
Current Estimated Value
Purchase Details
Closed on
Sep 22, 2011
Sold by
Jennings Richard D and Jennings Catherine M
Bought by
Haus Jon and Haus Kathy
Home Financials for this Owner
Home Financials are based on the most recent Mortgage that was taken out on this home.
Original Mortgage
$136,800
Interest Rate
4.01%
Mortgage Type
New Conventional
Purchase Details
Closed on
Jan 11, 2007
Sold by
Jennings Catherine M and Jennings Richard D
Bought by
Jennings Richard D and Jennings Catherine M
Home Financials for this Owner
Home Financials are based on the most recent Mortgage that was taken out on this home.
Original Mortgage
$270,000
Interest Rate
6.1%
Mortgage Type
New Conventional
Create a Home Valuation Report for This Property
The Home Valuation Report is an in-depth analysis detailing your home's value as well as a comparison with similar homes in the area
Home Values in the Area
Average Home Value in this Area
Purchase History
| Date | Buyer | Sale Price | Title Company |
|---|---|---|---|
| Haus Jon | -- | Chicago Title Company | |
| Haus Jon | $1,000 | Stewart Title Company | |
| Haus Jonathan R | $171,000 | Chicago Title Company | |
| Jennings Richard D | -- | Financial Title Company | |
| Jennings Richard D | -- | Financial Title Company |
Source: Public Records
Mortgage History
| Date | Status | Borrower | Loan Amount |
|---|---|---|---|
| Previous Owner | Haus Jonathan R | $136,800 | |
| Previous Owner | Jennings Richard D | $270,000 |
Source: Public Records
Tax History Compared to Growth
Tax History
| Year | Tax Paid | Tax Assessment Tax Assessment Total Assessment is a certain percentage of the fair market value that is determined by local assessors to be the total taxable value of land and additions on the property. | Land | Improvement |
|---|---|---|---|---|
| 2025 | $2,777 | $233,625 | $44,615 | $189,010 |
| 2024 | $2,777 | $229,044 | $43,740 | $185,304 |
| 2023 | $2,749 | $224,553 | $42,882 | $181,671 |
| 2022 | $2,694 | $220,150 | $42,041 | $178,109 |
| 2021 | $2,664 | $215,834 | $41,217 | $174,617 |
| 2020 | $2,662 | $213,621 | $40,794 | $172,827 |
| 2019 | $2,598 | $209,432 | $39,994 | $169,438 |
| 2018 | $2,631 | $205,326 | $39,210 | $166,116 |
| 2017 | $2,588 | $201,300 | $38,441 | $162,859 |
| 2016 | $2,543 | $197,353 | $37,687 | $159,666 |
| 2015 | $2,536 | $194,389 | $37,121 | $157,268 |
| 2014 | $2,483 | $190,581 | $36,394 | $154,187 |
Source: Public Records
Map
Nearby Homes
- 109 Fremont Rd
- 143 State Highway 173
- 0 Hwy 173 Unit IG25188518
- 0 State Hwy 173 Unit OC25061811
- 144 Marshall Rd
- 104 Fremont Rd
- 211 Heliotrope Dr
- 101 Mill Pond Rd
- 127 Mill Pond Rd
- 156 S Fremont Rd
- 0 Hook Creek Rd
- 229 Maple Dr
- 163 Bret Harte Rd
- 0 Pine Dr Unit IG24242295
- 0 Pine Dr Unit IV25194111
- 0 Pine Dr Unit ML82009544
- 658 Maple Dr
- 230 Fremont Rd
- 275 Ponderosa Peak Rd
- 0 Ponderosa Unit 25524469
- 140 S Fremont Rd
- 112 Fremont Rd
- 132 Fremont Rd
- 110 Fremont Rd
- 140 N Fremont Dr
- 140 N Fremont Rd
- 108 Fremont Rd
- 101 Fremont Rd
- 153 California 173
- 153 State Hwy
- 106 Fremont Rd
- 154 N Fremont Rd
- 125 S Fremont Rd
- 113 S Fremont Dr
- 100 S Fremont Rd
- 100 S Fremont Dr
- 239 Fremont Rd
- 140 Highway 173
- 140 State Highway 173
- 176 Mill Pond Rd