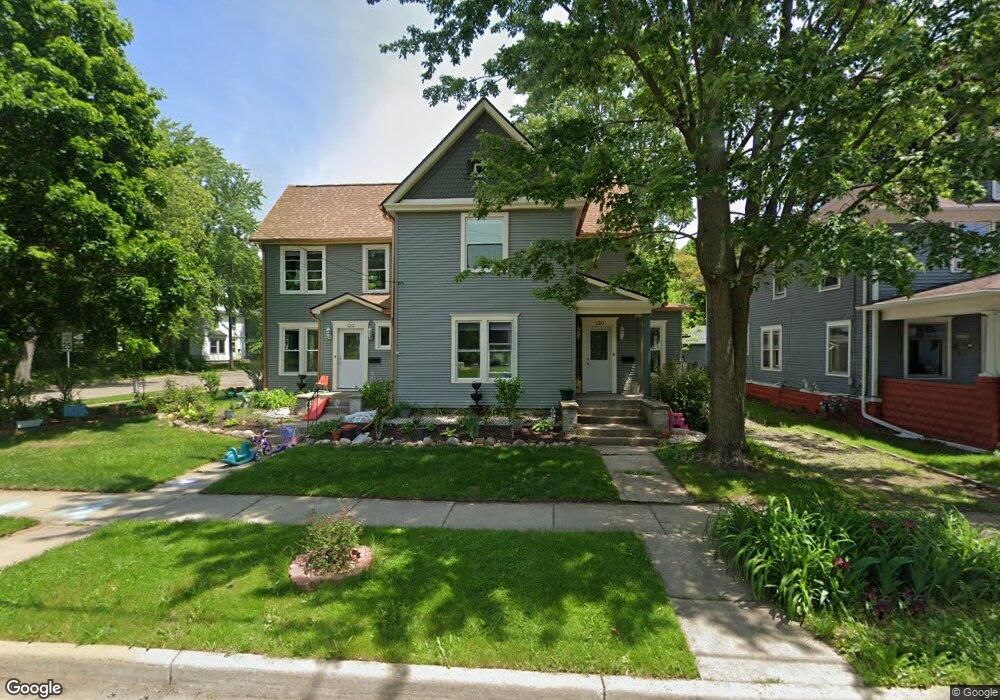
120 Fremont St Battle Creek, MI 49017
Northeast Battle Creek NeighborhoodEstimated Value: $63,000 - $146,000
2
Beds
2
Baths
2,890
Sq Ft
$39/Sq Ft
Est. Value
About This Home
This home is located at 120 Fremont St, Battle Creek, MI 49017 and is currently estimated at $112,992, approximately $39 per square foot. 120 Fremont St is a home located in Calhoun County with nearby schools including Northwestern Middle School, Battle Creek Central High School, and St. Philip Catholic Central High School.
Ownership History
Date
Name
Owned For
Owner Type
Purchase Details
Closed on
Jun 22, 2022
Sold by
Hixson Sheri D
Bought by
Hills Mandy
Current Estimated Value
Home Financials for this Owner
Home Financials are based on the most recent Mortgage that was taken out on this home.
Original Mortgage
$45,900
Outstanding Balance
$38,307
Interest Rate
4.32%
Mortgage Type
New Conventional
Estimated Equity
$74,685
Purchase Details
Closed on
Oct 2, 1996
Bought by
Hixson
Create a Home Valuation Report for This Property
The Home Valuation Report is an in-depth analysis detailing your home's value as well as a comparison with similar homes in the area
Home Values in the Area
Average Home Value in this Area
Purchase History
| Date | Buyer | Sale Price | Title Company |
|---|---|---|---|
| Hills Mandy | $54,000 | Nations Title | |
| Hixson | $80,500 | -- |
Source: Public Records
Mortgage History
| Date | Status | Borrower | Loan Amount |
|---|---|---|---|
| Open | Hills Mandy | $45,900 |
Source: Public Records
Tax History Compared to Growth
Tax History
| Year | Tax Paid | Tax Assessment Tax Assessment Total Assessment is a certain percentage of the fair market value that is determined by local assessors to be the total taxable value of land and additions on the property. | Land | Improvement |
|---|---|---|---|---|
| 2025 | -- | $26,900 | $0 | $0 |
| 2024 | $699 | $24,898 | $0 | $0 |
| 2023 | $1,684 | $17,500 | $0 | $0 |
| 2022 | $1,387 | $51,050 | $0 | $0 |
| 2021 | $1,855 | $39,659 | $0 | $0 |
| 2020 | $1,796 | $31,665 | $0 | $0 |
| 2019 | $1,826 | $27,672 | $0 | $0 |
| 2018 | $1,826 | $27,769 | $1,794 | $25,975 |
| 2017 | $1,919 | $29,443 | $0 | $0 |
| 2016 | $1,929 | $30,939 | $0 | $0 |
| 2015 | $2,262 | $29,885 | $2,620 | $27,265 |
| 2014 | $2,262 | $35,207 | $2,620 | $32,587 |
Source: Public Records
Map
Nearby Homes
- 114 Fremont St
- 19 Central St
- 105 Chestnut St
- 323 Garfield Ave
- 61 Rose St
- 45 Central St
- 162 Calhoun St
- 192 Fremont St
- 119 Calhoun St
- 273 Garfield Ave
- 14 Elizabeth St
- 78 Central St
- 51 Latta St
- 91 Sherman Rd
- 122 North Ave
- 31 Orchard Place
- 25 Orchard Place
- 162 Orchard Ave
- 286 Capital Ave NE
- 266 North Ave