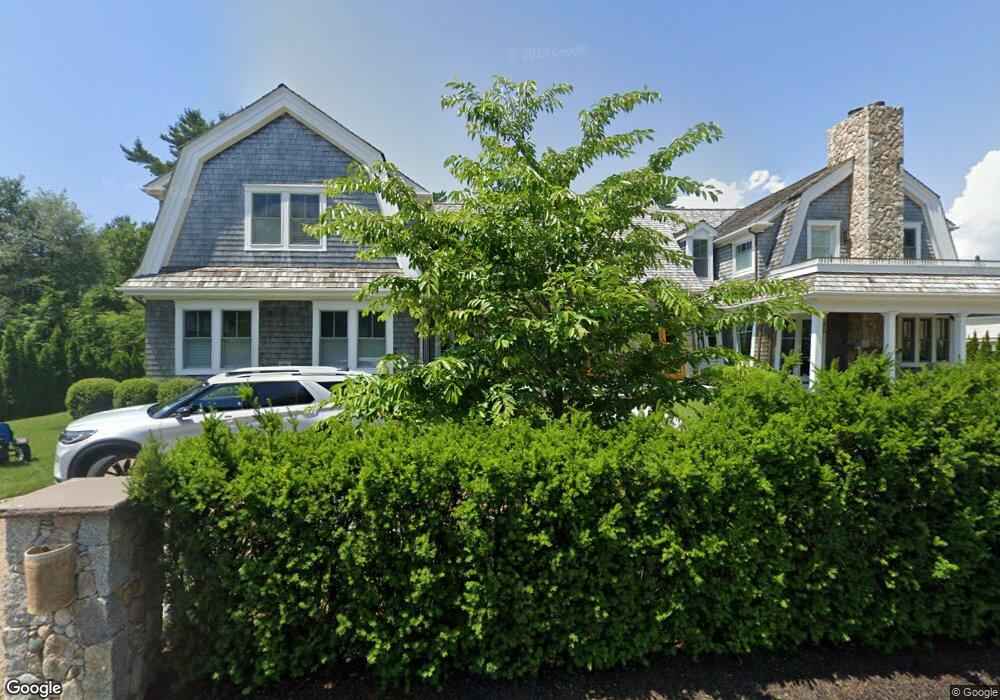
120 Front St Marion, MA 02738
Marion Center NeighborhoodEstimated Value: $2,531,000 - $3,599,106
4
Beds
8
Baths
7,616
Sq Ft
$411/Sq Ft
Est. Value
About This Home
This home is located at 120 Front St, Marion, MA 02738 and is currently estimated at $3,132,702, approximately $411 per square foot. 120 Front St is a home located in Plymouth County with nearby schools including Old Rochester Regional High School and Tabor Academy.
Ownership History
Date
Name
Owned For
Owner Type
Purchase Details
Closed on
May 9, 2019
Sold by
120 Front Street Llc
Bought by
L Orange Co
Current Estimated Value
Home Financials for this Owner
Home Financials are based on the most recent Mortgage that was taken out on this home.
Original Mortgage
$500,000
Outstanding Balance
$436,871
Interest Rate
4.1%
Mortgage Type
New Conventional
Estimated Equity
$2,695,831
Purchase Details
Closed on
Nov 1, 2013
Sold by
Barbara M Sell Rt and Sowden
Bought by
120 Front Street Llc
Home Financials for this Owner
Home Financials are based on the most recent Mortgage that was taken out on this home.
Original Mortgage
$180,000
Interest Rate
4.52%
Mortgage Type
New Conventional
Purchase Details
Closed on
Jun 13, 2002
Sold by
1St Parish Rd Co Inc
Bought by
Scituate Harbor Dev
Create a Home Valuation Report for This Property
The Home Valuation Report is an in-depth analysis detailing your home's value as well as a comparison with similar homes in the area
Home Values in the Area
Average Home Value in this Area
Purchase History
| Date | Buyer | Sale Price | Title Company |
|---|---|---|---|
| L Orange Co | -- | -- | |
| L Orange Co | -- | -- | |
| L Orange Co | -- | -- | |
| 120 Front Street Llc | $400,000 | -- | |
| 120 Front Street Llc | $400,000 | -- | |
| Scituate Harbor Dev | $2,066,767 | -- | |
| Scituate Harbor Dev | $2,066,767 | -- | |
| Scituate Harbor Dev | $2,066,767 | -- |
Source: Public Records
Mortgage History
| Date | Status | Borrower | Loan Amount |
|---|---|---|---|
| Open | L Orange Co | $500,000 | |
| Closed | L Orange Co | $500,000 | |
| Previous Owner | 120 Front Street Llc | $180,000 |
Source: Public Records
Tax History Compared to Growth
Tax History
| Year | Tax Paid | Tax Assessment Tax Assessment Total Assessment is a certain percentage of the fair market value that is determined by local assessors to be the total taxable value of land and additions on the property. | Land | Improvement |
|---|---|---|---|---|
| 2025 | $31,968 | $3,430,000 | $500,100 | $2,929,900 |
| 2024 | $31,931 | $3,448,300 | $456,600 | $2,991,700 |
| 2023 | $23,685 | $2,509,000 | $424,000 | $2,085,000 |
| 2022 | $19,998 | $1,843,100 | $409,800 | $1,433,300 |
| 2021 | $18,439 | $1,628,900 | $378,500 | $1,250,400 |
| 2020 | $9,655 | $825,200 | $302,200 | $523,000 |
| 2019 | $4,489 | $407,000 | $275,200 | $131,800 |
| 2018 | $4,950 | $432,300 | $299,100 | $133,200 |
| 2017 | $4,933 | $432,300 | $299,100 | $133,200 |
| 2016 | $4,889 | $432,300 | $299,100 | $133,200 |
| 2015 | $4,906 | $441,600 | $308,400 | $133,200 |
Source: Public Records
Map
Nearby Homes