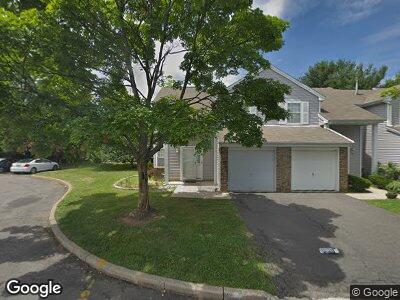
120 Fulton Ct Unit 42 New Brunswick, NJ 08901
Estimated Value: $347,000 - $360,000
2
Beds
3
Baths
1,087
Sq Ft
$326/Sq Ft
Est. Value
About This Home
This home is located at 120 Fulton Ct Unit 42, New Brunswick, NJ 08901 and is currently estimated at $354,483, approximately $326 per square foot. 120 Fulton Ct Unit 42 is a home located in Middlesex County with nearby schools including New Brunswick High School, Central Jersey College Prep Charter School, and St. Mary of Mount Virgin School.
Ownership History
Date
Name
Owned For
Owner Type
Purchase Details
Closed on
Aug 30, 2022
Sold by
Fu and Wei
Bought by
Bektas Ozgur and Bektas Cemile
Current Estimated Value
Home Financials for this Owner
Home Financials are based on the most recent Mortgage that was taken out on this home.
Original Mortgage
$240,000
Outstanding Balance
$232,197
Interest Rate
5.3%
Mortgage Type
New Conventional
Estimated Equity
$97,291
Purchase Details
Closed on
Jun 20, 2014
Sold by
Frantino Patricia
Bought by
Fu Yu and Zhang Wei
Home Financials for this Owner
Home Financials are based on the most recent Mortgage that was taken out on this home.
Original Mortgage
$110,250
Interest Rate
4.14%
Mortgage Type
New Conventional
Purchase Details
Closed on
Sep 23, 2001
Sold by
Marchak Donald
Bought by
Frantinoo Patricia
Home Financials for this Owner
Home Financials are based on the most recent Mortgage that was taken out on this home.
Original Mortgage
$74,300
Interest Rate
6.86%
Mortgage Type
FHA
Create a Home Valuation Report for This Property
The Home Valuation Report is an in-depth analysis detailing your home's value as well as a comparison with similar homes in the area
Home Values in the Area
Average Home Value in this Area
Purchase History
| Date | Buyer | Sale Price | Title Company |
|---|---|---|---|
| Bektas Ozgur | $270,000 | -- | |
| Fu Yu | $122,500 | East Coast Title Agency | |
| Frantinoo Patricia | $77,000 | -- |
Source: Public Records
Mortgage History
| Date | Status | Borrower | Loan Amount |
|---|---|---|---|
| Open | Bektas Ozgur | $240,000 | |
| Previous Owner | Fu Yu | $110,250 | |
| Previous Owner | Fratinno Patricia | $70,000 | |
| Previous Owner | Frantinoo Patricia | $74,300 |
Source: Public Records
Tax History Compared to Growth
Tax History
| Year | Tax Paid | Tax Assessment Tax Assessment Total Assessment is a certain percentage of the fair market value that is determined by local assessors to be the total taxable value of land and additions on the property. | Land | Improvement |
|---|---|---|---|---|
| 2024 | $3,743 | $147,200 | $65,000 | $82,200 |
| 2023 | $3,743 | $147,200 | $65,000 | $82,200 |
| 2022 | $3,664 | $147,200 | $65,000 | $82,200 |
| 2021 | $3,649 | $147,200 | $65,000 | $82,200 |
| 2020 | $2,583 | $147,200 | $65,000 | $82,200 |
| 2019 | $2,840 | $147,200 | $65,000 | $82,200 |
| 2018 | $2,834 | $147,200 | $65,000 | $82,200 |
| 2017 | $2,691 | $147,200 | $65,000 | $82,200 |
| 2016 | $246 | $4,200 | $4,200 | $0 |
| 2015 | $240 | $4,200 | $4,200 | $0 |
| 2014 | $236 | $4,200 | $4,200 | $0 |
Source: Public Records
Map
Nearby Homes
- 105 Renaissance Ln
- 1338 Fernwood Ct Unit 1338
- 135 Lawrence St
- 166 Fulton St
- 95 Lawrence St
- 97 N Ward St
- 55 Renaissance Ln
- 172 Lawrence St
- 4 N Ward St
- 75 Georges Rd
- 173 Rutgers St
- 195 Ward St
- 23 Hazelhurst St
- 44 S Ward St
- 7 Hazelhurst St
- 349 Livingston Ave
- 72 Comstock St
- 220 Paul Robeson Blvd
- 193 Delavan St
- 5 Llewellyn Place
- 120 Fulton Ct
- 120 Fulton Ct Unit 42
- 122 Fulton Ct
- 124 Fulton Ct
- 94 Renaissance Ln
- 96 Renaissance Ln Unit 49
- 98 Renaissance Ln
- 92 Renaissance Ln
- 126 Fulton Ct
- 126 Fulton Ct Unit 45
- 128 Fulton Ct Unit 19E
- 111 Fulton Ct
- 109 Fulton Ct
- 107 Fulton Ct
- 113 Fulton Ct
- 812 Cedar Ct
- 822 Cedar Ct
- 105 Fulton Ct
- 105 Fulton Ct Unit 39
- 814 Cedar Ct