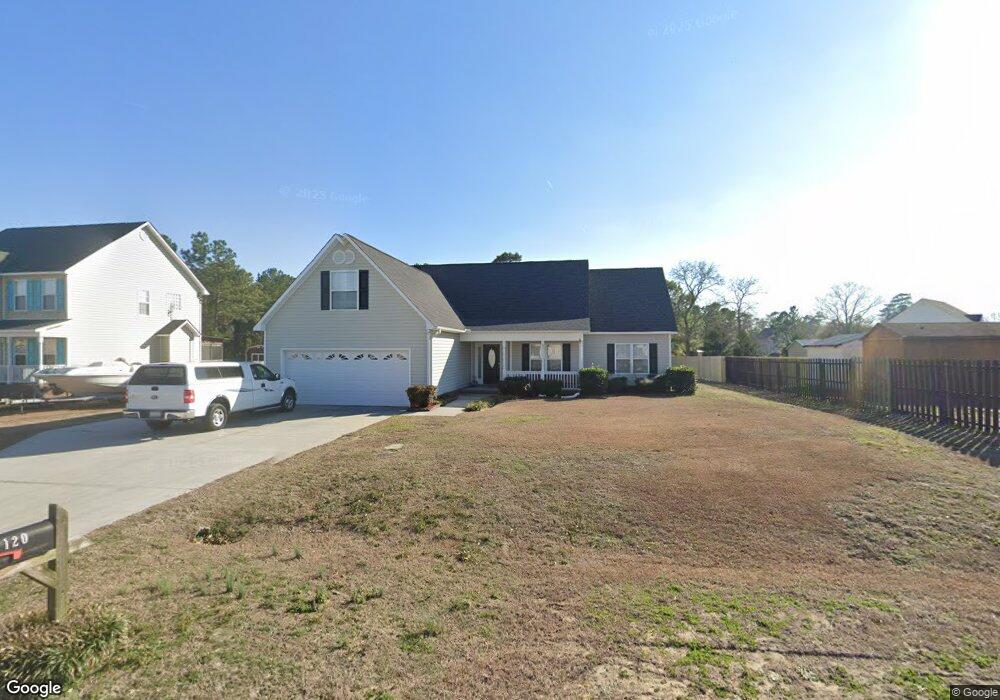
120 Harvest Moon Dr Richlands, NC 28574
Estimated Value: $300,461 - $310,000
3
Beds
2
Baths
1,906
Sq Ft
$160/Sq Ft
Est. Value
About This Home
This home is located at 120 Harvest Moon Dr, Richlands, NC 28574 and is currently estimated at $305,615, approximately $160 per square foot. 120 Harvest Moon Dr is a home located in Onslow County with nearby schools including Richlands Elementary School, Trexler Middle School, and Richlands High School.
Ownership History
Date
Name
Owned For
Owner Type
Purchase Details
Closed on
Mar 31, 2005
Sold by
A Sydes Construction Inc
Bought by
Seyler Christopher J and Seyler Cindy L
Current Estimated Value
Home Financials for this Owner
Home Financials are based on the most recent Mortgage that was taken out on this home.
Original Mortgage
$120,000
Outstanding Balance
$60,796
Interest Rate
5.6%
Mortgage Type
New Conventional
Estimated Equity
$244,819
Purchase Details
Closed on
Mar 16, 2005
Sold by
A Sydes Construction Inc
Bought by
Cotton Mark S and Cotton Joylynn L
Home Financials for this Owner
Home Financials are based on the most recent Mortgage that was taken out on this home.
Original Mortgage
$120,000
Outstanding Balance
$60,796
Interest Rate
5.6%
Mortgage Type
New Conventional
Estimated Equity
$244,819
Purchase Details
Closed on
Feb 25, 2005
Sold by
A Sydes Construction Inc
Bought by
Edwards Ronald L and Edwards Anne G
Home Financials for this Owner
Home Financials are based on the most recent Mortgage that was taken out on this home.
Original Mortgage
$120,000
Outstanding Balance
$60,796
Interest Rate
5.6%
Mortgage Type
New Conventional
Estimated Equity
$244,819
Create a Home Valuation Report for This Property
The Home Valuation Report is an in-depth analysis detailing your home's value as well as a comparison with similar homes in the area
Home Values in the Area
Average Home Value in this Area
Purchase History
| Date | Buyer | Sale Price | Title Company |
|---|---|---|---|
| Seyler Christopher J | $162,000 | None Available | |
| Cotton Mark S | $162,500 | None Available | |
| Edwards Ronald L | $163,500 | None Available |
Source: Public Records
Mortgage History
| Date | Status | Borrower | Loan Amount |
|---|---|---|---|
| Open | Edwards Ronald L | $120,000 |
Source: Public Records
Tax History Compared to Growth
Tax History
| Year | Tax Paid | Tax Assessment Tax Assessment Total Assessment is a certain percentage of the fair market value that is determined by local assessors to be the total taxable value of land and additions on the property. | Land | Improvement |
|---|---|---|---|---|
| 2025 | $1,447 | $220,953 | $32,000 | $188,953 |
| 2024 | $1,447 | $220,953 | $32,000 | $188,953 |
| 2023 | $1,447 | $220,953 | $32,000 | $188,953 |
| 2022 | $1,447 | $220,953 | $32,000 | $188,953 |
| 2021 | $1,270 | $180,120 | $32,000 | $148,120 |
| 2020 | $1,270 | $180,120 | $32,000 | $148,120 |
| 2019 | $1,150 | $163,100 | $32,000 | $131,100 |
| 2018 | $1,270 | $180,120 | $32,000 | $148,120 |
| 2017 | $1,128 | $167,140 | $25,000 | $142,140 |
| 2016 | $1,128 | $167,140 | $0 | $0 |
| 2015 | $1,128 | $167,140 | $0 | $0 |
| 2014 | $1,128 | $167,140 | $0 | $0 |
Source: Public Records
Map
Nearby Homes
- 250 Rowland Dr
- 260 Rowland Dr
- 503 Hester Ct
- 1955 Catherine Lake Rd
- 224 Rowland Dr
- 712 Addor Dr
- 106 Orchard Dr
- 227 Bannermans Mill Rd
- 233 Pineview Rd
- 105 Linden Rd
- 248 Fire Tower Rd
- 109 Floyd Pond Ln
- 235 Westfield Dr
- 115 Flat Rock Ln
- 119 Edgewater Ln
- 252 Newbold Rd
- 145 Mcgowan
- 1.7ac Mcgowan Rd
- 118 Lindsey James Ln
- 101 Daleview Ct
- 122 Harvest Moon Dr
- 303 Ivy Brook Ct
- 118 Harvest Moon Dr
- 305 Ivy Brook Ct
- 124 Harvest Moon Dr
- 121 Harvest Moon Dr
- 119 Harvest Moon Dr
- 123 Harvest Moon Dr
- 117 Harvest Moon Dr
- 306 Ivy Brook Ct
- 125 Harvest Moon Dr
- 115 Harvest Moon Dr
- 127 Harvest Moon Dr
- 300 Ivy Brook Ct
- 304 Ivy Brook Ct
- 113 Harvest Moon Dr
- 129 Harvest Moon Dr
- 254 Rowland Dr
- 252 Rowland Dr
- 224 Star Gazer Ct