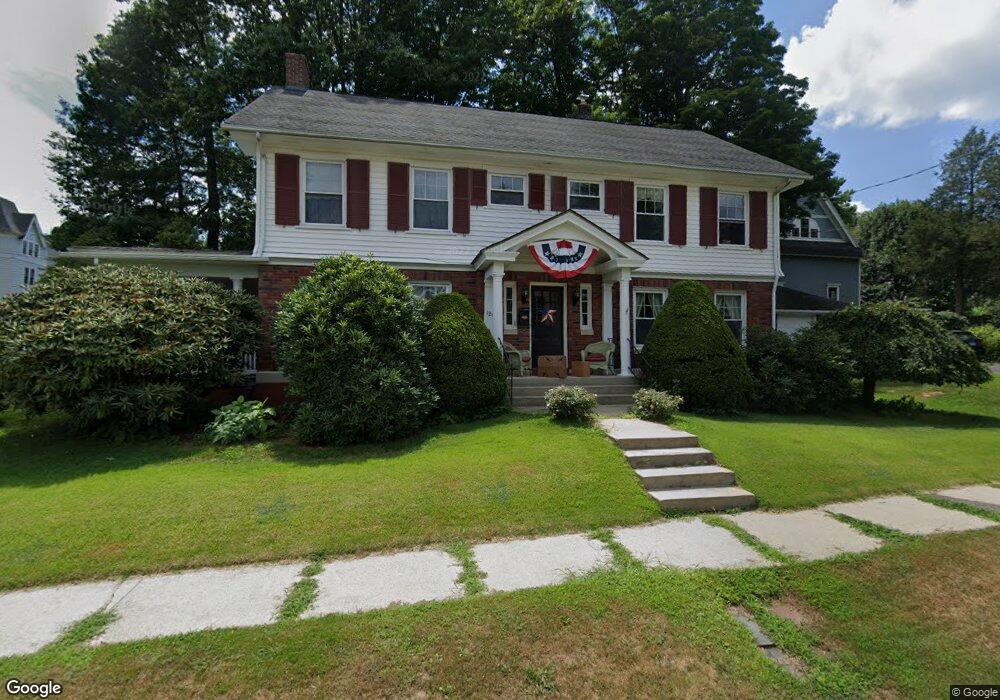
120 Holabird Ave Winsted, CT 06098
Estimated Value: $375,000 - $483,178
6
Beds
4
Baths
2,970
Sq Ft
$140/Sq Ft
Est. Value
About This Home
This home is located at 120 Holabird Ave, Winsted, CT 06098 and is currently estimated at $416,295, approximately $140 per square foot. 120 Holabird Ave is a home located in Litchfield County with nearby schools including Explorations Charter School, St Anthony School, and The Gilbert School.
Ownership History
Date
Name
Owned For
Owner Type
Purchase Details
Closed on
Dec 17, 2007
Sold by
Circuit City Stores In
Bought by
Baril Marcel F and Baril Debbie O
Current Estimated Value
Purchase Details
Closed on
Feb 21, 2007
Sold by
Chapman Samuel L and Chapman Wendy L
Bought by
Circuit City Stores In
Purchase Details
Closed on
Aug 31, 1999
Sold by
Dolinsky Shirley Z
Bought by
Chapman Samuel L and Chapman Wendy L
Create a Home Valuation Report for This Property
The Home Valuation Report is an in-depth analysis detailing your home's value as well as a comparison with similar homes in the area
Home Values in the Area
Average Home Value in this Area
Purchase History
| Date | Buyer | Sale Price | Title Company |
|---|---|---|---|
| Baril Marcel F | $270,000 | -- | |
| Baril Marcel F | $270,000 | -- | |
| Circuit City Stores In | $300,000 | -- | |
| Circuit City Stores In | $300,000 | -- | |
| Chapman Samuel L | $180,500 | -- | |
| Chapman Samuel L | $180,500 | -- |
Source: Public Records
Mortgage History
| Date | Status | Borrower | Loan Amount |
|---|---|---|---|
| Open | Chapman Samuel L | $202,500 | |
| Closed | Chapman Samuel L | $213,000 |
Source: Public Records
Tax History Compared to Growth
Tax History
| Year | Tax Paid | Tax Assessment Tax Assessment Total Assessment is a certain percentage of the fair market value that is determined by local assessors to be the total taxable value of land and additions on the property. | Land | Improvement |
|---|---|---|---|---|
| 2025 | $7,488 | $256,690 | $32,970 | $223,720 |
| 2024 | $6,992 | $256,690 | $32,970 | $223,720 |
| 2023 | $6,774 | $256,690 | $32,970 | $223,720 |
| 2022 | $5,163 | $153,930 | $23,940 | $129,990 |
| 2021 | $5,163 | $153,930 | $23,940 | $129,990 |
| 2020 | $5,163 | $153,930 | $23,940 | $129,990 |
| 2019 | $3,977 | $153,930 | $23,940 | $129,990 |
| 2018 | $5,163 | $153,930 | $23,940 | $129,990 |
| 2017 | $3,940 | $150,710 | $23,940 | $126,770 |
| 2016 | $5,055 | $150,710 | $23,940 | $126,770 |
| 2015 | $4,928 | $150,710 | $23,940 | $126,770 |
| 2014 | $4,809 | $150,710 | $23,940 | $126,770 |
Source: Public Records
Map
Nearby Homes