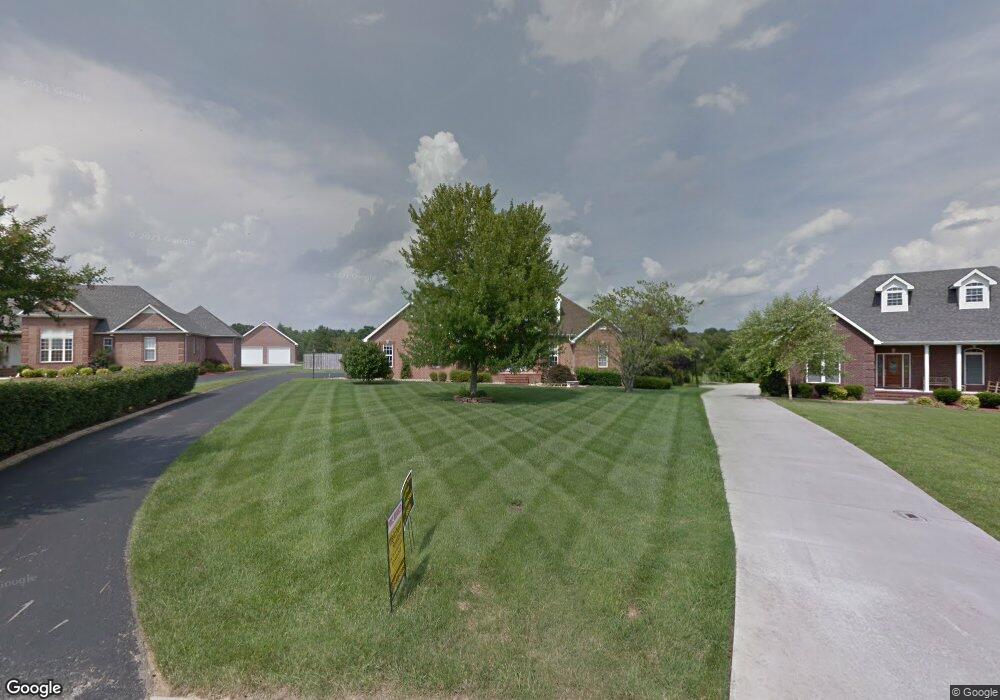
120 Hunters Ridge Dr Tullahoma, TN 37388
Estimated Value: $511,862 - $632,000
4
Beds
3
Baths
3,630
Sq Ft
$156/Sq Ft
Est. Value
About This Home
This home is located at 120 Hunters Ridge Dr, Tullahoma, TN 37388 and is currently estimated at $567,966, approximately $156 per square foot. 120 Hunters Ridge Dr is a home located in Coffee County with nearby schools including Tullahoma High School, Highland Rim Christian Academy, and Tullahoma Christian Academy.
Ownership History
Date
Name
Owned For
Owner Type
Purchase Details
Closed on
Jan 31, 2014
Sold by
Mortensen James P
Bought by
Caps J William
Current Estimated Value
Purchase Details
Closed on
Mar 1, 2005
Sold by
Grecco Rhonda L
Bought by
Mortensen James P
Home Financials for this Owner
Home Financials are based on the most recent Mortgage that was taken out on this home.
Original Mortgage
$247,300
Interest Rate
5.6%
Purchase Details
Closed on
Feb 28, 2005
Sold by
Grecco Rhonda L
Bought by
Mortensen James P
Home Financials for this Owner
Home Financials are based on the most recent Mortgage that was taken out on this home.
Original Mortgage
$247,300
Interest Rate
5.6%
Purchase Details
Closed on
Feb 22, 2000
Sold by
M & B Development Llc
Bought by
Grecco Anthony and Grecco Rhonda L
Purchase Details
Closed on
Nov 13, 1998
Sold by
Hall Tim and Hall Tammy
Bought by
Greeco Anthony and Greeco Rhonda L
Purchase Details
Closed on
Mar 13, 1998
Sold by
M & B Development
Bought by
Hall Tim and Hall Tammy
Create a Home Valuation Report for This Property
The Home Valuation Report is an in-depth analysis detailing your home's value as well as a comparison with similar homes in the area
Home Values in the Area
Average Home Value in this Area
Purchase History
| Date | Buyer | Sale Price | Title Company |
|---|---|---|---|
| Caps J William | $250,000 | -- | |
| Mortensen James P | $247,000 | -- | |
| Mortensen James P | $247,000 | -- | |
| Grecco Anthony | $2,400 | -- | |
| Greeco Anthony | $205,000 | -- | |
| Hall Tim | $24,900 | -- |
Source: Public Records
Mortgage History
| Date | Status | Borrower | Loan Amount |
|---|---|---|---|
| Previous Owner | Hall Tim | $247,300 |
Source: Public Records
Tax History Compared to Growth
Tax History
| Year | Tax Paid | Tax Assessment Tax Assessment Total Assessment is a certain percentage of the fair market value that is determined by local assessors to be the total taxable value of land and additions on the property. | Land | Improvement |
|---|---|---|---|---|
| 2024 | $3,381 | $86,550 | $9,000 | $77,550 |
| 2023 | $3,381 | $86,550 | $0 | $0 |
| 2022 | $3,469 | $86,550 | $9,000 | $77,550 |
| 2021 | $3,271 | $65,250 | $6,250 | $59,000 |
| 2020 | $3,271 | $65,250 | $6,250 | $59,000 |
| 2019 | $3,271 | $65,250 | $6,250 | $59,000 |
| 2018 | $3,271 | $65,250 | $6,250 | $59,000 |
| 2017 | $3,143 | $57,475 | $7,500 | $49,975 |
| 2016 | $3,144 | $57,475 | $7,500 | $49,975 |
| 2015 | $3,144 | $57,475 | $7,500 | $49,975 |
| 2014 | $3,145 | $57,485 | $0 | $0 |
Source: Public Records
Map
Nearby Homes
- 105 Quail Dr
- 887 Ovoca Lake Rd
- 49 Copperas Creek Rd
- 933 Ovoca Lake Rd
- 128 Copperas Creek Rd
- 530 Parkway Rd
- 1318 Riley Creek Rd
- 236 Emmett Stone Ln
- 110 Autumn Ln
- 104 Collinwood Dr
- 0 Ovoca Rd
- 2320 Ovoca Rd
- 26 Pine Ridge Dr
- 66 Pine Ridge Dr
- 62 Pine Ridge Dr
- 2219 Ovoca Rd
- 77 Pine Ridge Dr
- 71 Pine Ridge Dr
- 3481 Normandy Rd
- 13 Pinewood Cove
- 118 Hunters Ridge Dr
- 122 Hunters Ridge Dr
- 116 Hunters Ridge Dr
- 124 Hunters Ridge Dr
- 117 Hunters Ridge Dr
- 126 Hunters Ridge Dr
- 114 Hunters Ridge Dr
- 115 Hunters Ridge Dr
- 128 Hunters Ridge Dr
- 112 Hunters Ridge Dr
- 101 Quail Dr
- 113 Hunters Ridge Dr
- 103 Quail Dr
- 130 Hunters Ridge Dr
- 110 Hunters Ridge Dr
- 111 Hunters Ridge Dr
- 502 Hickory Ridge Ln
- 108 Hunters Ridge Dr
- 132 Hunters Ridge Dr
- 107 Quail Dr