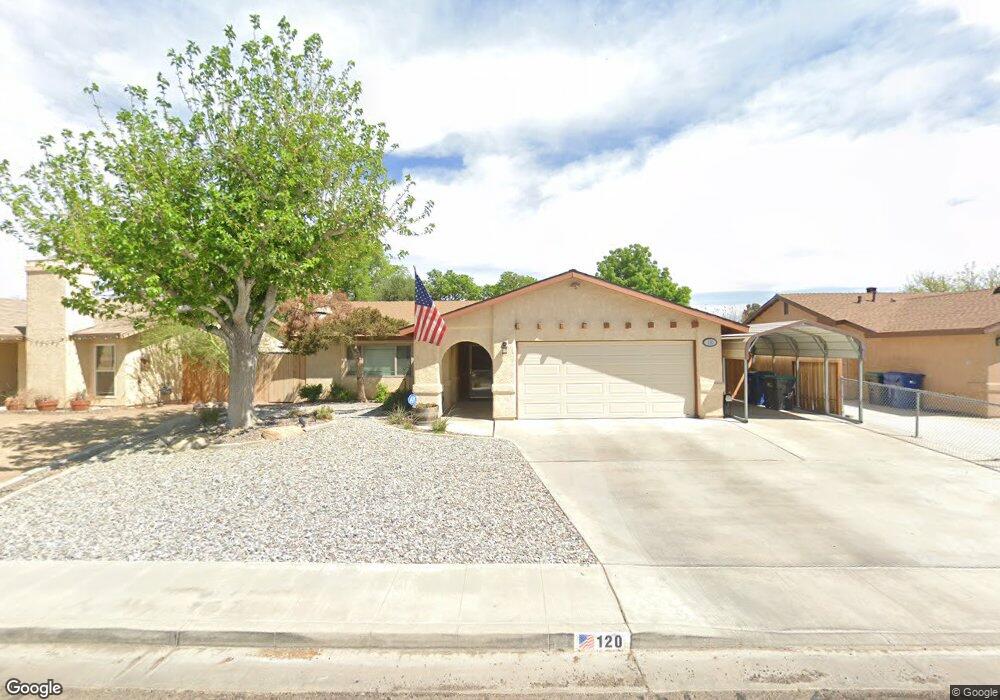
120 Jacquelyn Ct Ridgecrest, CA 93555
Estimated Value: $262,000 - $280,000
3
Beds
2
Baths
1,502
Sq Ft
$181/Sq Ft
Est. Value
About This Home
This home is located at 120 Jacquelyn Ct, Ridgecrest, CA 93555 and is currently estimated at $271,326, approximately $180 per square foot. 120 Jacquelyn Ct is a home located in Kern County with nearby schools including Pierce Elementary School, Murray Middle School, and Burroughs High School.
Ownership History
Date
Name
Owned For
Owner Type
Purchase Details
Closed on
Nov 18, 2021
Sold by
Varga Sheryl L and Varga Stephan J
Bought by
Maxwell Steven D
Current Estimated Value
Purchase Details
Closed on
Feb 14, 2019
Sold by
Varga Sheryl L
Bought by
Varga Sheryl L and Varga Stephen J
Purchase Details
Closed on
Apr 25, 2016
Sold by
Scanlon Sheryl L
Bought by
Scanlon Sheryl L and Sheryl Lynn Scanlon Trust
Purchase Details
Closed on
May 5, 2009
Sold by
Morrison Jerry L and Morrison Marie R
Bought by
Scanlon John J and Scanlon Sheryl L
Home Financials for this Owner
Home Financials are based on the most recent Mortgage that was taken out on this home.
Original Mortgage
$156,800
Interest Rate
4.83%
Mortgage Type
Purchase Money Mortgage
Create a Home Valuation Report for This Property
The Home Valuation Report is an in-depth analysis detailing your home's value as well as a comparison with similar homes in the area
Home Values in the Area
Average Home Value in this Area
Purchase History
| Date | Buyer | Sale Price | Title Company |
|---|---|---|---|
| Maxwell Steven D | $250,000 | Chicago Title Company | |
| Varga Sheryl L | -- | None Available | |
| Scanlon Sheryl L | -- | None Available | |
| Scanlon John J | $196,000 | First American Title Company |
Source: Public Records
Mortgage History
| Date | Status | Borrower | Loan Amount |
|---|---|---|---|
| Previous Owner | Scanlon John J | $156,800 |
Source: Public Records
Tax History
| Year | Tax Paid | Tax Assessment Tax Assessment Total Assessment is a certain percentage of the fair market value that is determined by local assessors to be the total taxable value of land and additions on the property. | Land | Improvement |
|---|---|---|---|---|
| 2025 | $3,421 | $265,301 | $42,448 | $222,853 |
| 2024 | $3,319 | $260,100 | $41,616 | $218,484 |
| 2023 | $3,319 | $255,000 | $40,800 | $214,200 |
| 2022 | $3,253 | $250,000 | $40,000 | $210,000 |
| 2021 | $2,534 | $194,000 | $49,000 | $145,000 |
| 2020 | $2,410 | $186,000 | $47,000 | $139,000 |
| 2019 | $2,366 | $182,000 | $46,000 | $136,000 |
| 2018 | $2,328 | $179,000 | $45,000 | $134,000 |
| 2017 | $2,193 | $164,000 | $41,000 | $123,000 |
| 2016 | $1,959 | $147,000 | $37,000 | $110,000 |
| 2015 | $1,542 | $109,000 | $27,000 | $82,000 |
| 2014 | $1,592 | $124,000 | $31,000 | $93,000 |
Source: Public Records
Map
Nearby Homes
- 134 N American St
- 209 Kimberly Ln
- 136 Rawhide Ln
- 252 N Broadway St
- 142 Chambers St
- 309 N Sunland Dr
- 602 Commercial Ave
- 0 Commercial Ave
- 729 N Sunland Dr Unit H
- 505 Cottonwood Dr
- 135 S Broadway St
- 824 Commercial Ave
- 201 S Greenlawn St
- 205 Rancho St
- 0 S Gateway Blvd
- 384 E California Ave
- 544 Beth Ln
- 314 Reese St
- 920 E Church Ave
- 343032 Ridgecrest
- 116 Jacquelyn Ct Unit B
- 119 N Gwen Dr
- 115 N Gwen Dr
- 128 Jacquelyn Ct
- 634 Cottonwood Dr
- 111 N Gwen Dr
- 123 N Gwen Dr Unit C
- 119 Jacquelyn Ct
- 115 Jacquelyn Ct
- 123 Jacquelyn Ct
- 134 Jacquelyn Ct
- 127 Jacquelyn Ct
- 626 Cottonwood Dr
- 127 N Gwen Dr
- 138 Jacquelyn Ct Unit B
- 131 Jacquelyn Ct
- 120 N American St Unit A
- 124 N American St
- 712 Cottonwood Dr Unit C
- 637 Cottonwood Dr
Your Personal Tour Guide
Ask me questions while you tour the home.