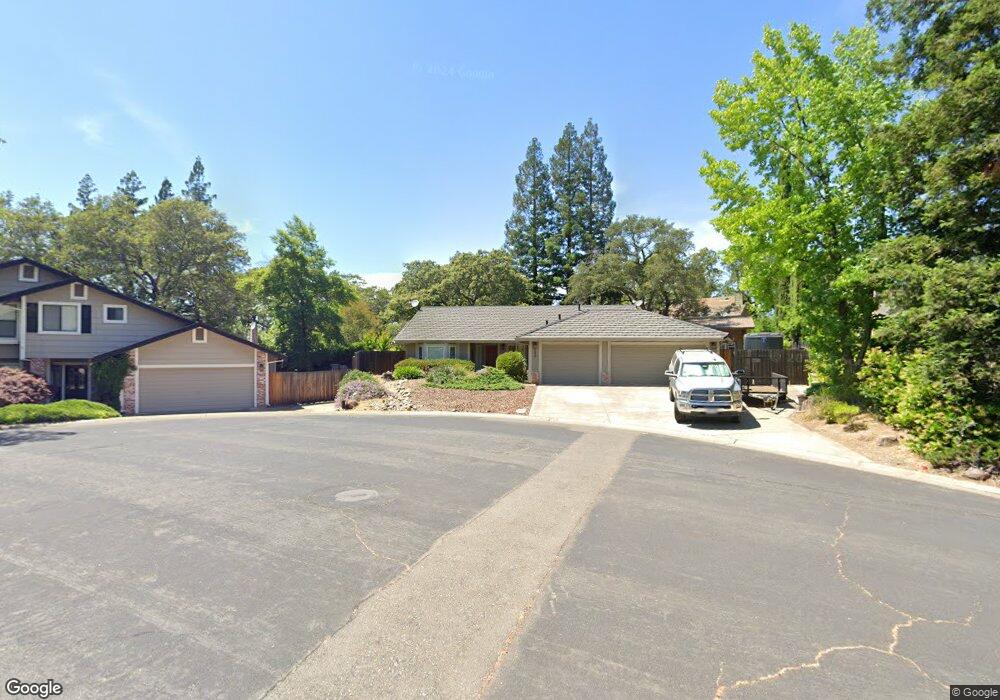
120 Johnston Ct Folsom, CA 95630
Briggs Ranch NeighborhoodEstimated Value: $700,000 - $749,000
4
Beds
2
Baths
1,983
Sq Ft
$367/Sq Ft
Est. Value
About This Home
This home is located at 120 Johnston Ct, Folsom, CA 95630 and is currently estimated at $728,551, approximately $367 per square foot. 120 Johnston Ct is a home located in Sacramento County with nearby schools including Blanche Sprentz Elementary School, Sutter Middle School, and St. John Notre Dame School.
Ownership History
Date
Name
Owned For
Owner Type
Purchase Details
Closed on
Mar 24, 2020
Sold by
Lynch Charles J and Lynch Deena L
Bought by
Lynch Charles J and Lynch Deena J
Current Estimated Value
Home Financials for this Owner
Home Financials are based on the most recent Mortgage that was taken out on this home.
Original Mortgage
$325,285
Interest Rate
3.4%
Mortgage Type
VA
Purchase Details
Closed on
Sep 8, 2017
Sold by
Lynch Charles J and Masera Lynch Deena L
Bought by
Lynch Charles J and Lynch Deena L
Home Financials for this Owner
Home Financials are based on the most recent Mortgage that was taken out on this home.
Original Mortgage
$299,845
Interest Rate
3.89%
Mortgage Type
VA
Purchase Details
Closed on
Aug 21, 2013
Sold by
Lynch Charles John and Lynch Deena
Bought by
The Lynch Family Trust
Purchase Details
Closed on
Jun 26, 2012
Sold by
Lynch Charles John and Lynch Denna
Bought by
Lynch Charles John and Lynch Deena
Home Financials for this Owner
Home Financials are based on the most recent Mortgage that was taken out on this home.
Original Mortgage
$340,890
Interest Rate
3.74%
Mortgage Type
VA
Create a Home Valuation Report for This Property
The Home Valuation Report is an in-depth analysis detailing your home's value as well as a comparison with similar homes in the area
Home Values in the Area
Average Home Value in this Area
Purchase History
| Date | Buyer | Sale Price | Title Company |
|---|---|---|---|
| Lynch Charles J | -- | Accommodation | |
| Lynch Charles J | -- | Ticor Title Natl Com Svcs | |
| Lynch Charles J | -- | Chicago Title Company | |
| Lynch Charles J | -- | Chicago Title Company | |
| The Lynch Family Trust | -- | None Available | |
| Lynch Charles John | -- | Lawyers Title |
Source: Public Records
Mortgage History
| Date | Status | Borrower | Loan Amount |
|---|---|---|---|
| Closed | Lynch Charles J | $325,285 | |
| Closed | Lynch Charles J | $299,845 | |
| Closed | Lynch Charles John | $340,890 |
Source: Public Records
Tax History Compared to Growth
Tax History
| Year | Tax Paid | Tax Assessment Tax Assessment Total Assessment is a certain percentage of the fair market value that is determined by local assessors to be the total taxable value of land and additions on the property. | Land | Improvement |
|---|---|---|---|---|
| 2025 | $919 | $259,203 | $70,265 | $188,938 |
| 2024 | $919 | $254,122 | $68,888 | $185,234 |
| 2023 | $961 | $249,140 | $67,538 | $181,602 |
| 2022 | $1,034 | $244,256 | $66,214 | $178,042 |
| 2021 | $1,015 | $239,467 | $64,916 | $174,551 |
| 2020 | $1,191 | $237,013 | $64,251 | $172,762 |
| 2019 | $2,491 | $232,367 | $62,992 | $169,375 |
| 2018 | $2,428 | $227,811 | $61,757 | $166,054 |
| 2017 | $2,263 | $223,346 | $60,547 | $162,799 |
| 2016 | $2,363 | $218,967 | $59,360 | $159,607 |
| 2015 | $2,282 | $215,679 | $58,469 | $157,210 |
| 2014 | $2,165 | $211,455 | $57,324 | $154,131 |
Source: Public Records
Map
Nearby Homes
- 109 Johnston Ct
- 237 Evelyn Way
- 260 Flower Dr
- 164 Rebecca Way
- 124 Windstar Cir
- 128 Mesquite Ct
- 124 Fargo Way
- 106 Rhoades Way
- 103 Grenoble Way
- 214 Rugosa Dr
- 102 Grenoble Way
- 1118 Buckbrush Dr
- 151 Glenn Dr
- 166 Market St
- 167 Price Way
- 1173 Boxelder Cir
- 182 Price Way
- 98-98 1/2 Dean Way
- 408-408 1/2 Reading St
- 616-616 1/2 Mormon St
- 116 Johnston Ct
- 108 Bunker Ct
- 124 Johnston Ct
- 104 Bunker Ct
- 112 Bunker Ct
- 125 Johnston Ct
- 112 Johnston Ct
- 205 Willow Creek Dr
- 100 Bunker Ct
- 209 Willow Creek Dr
- 121 Johnston Ct
- 117 Johnston Ct
- 113 Bunker Ct
- 213 Willow Creek Dr
- 108 Johnston Ct
- 115 Thomas Ct
- 113 Johnston Ct
- 111 Thomas Ct
- 105 Bunker Ct
- 109 Bunker Ct