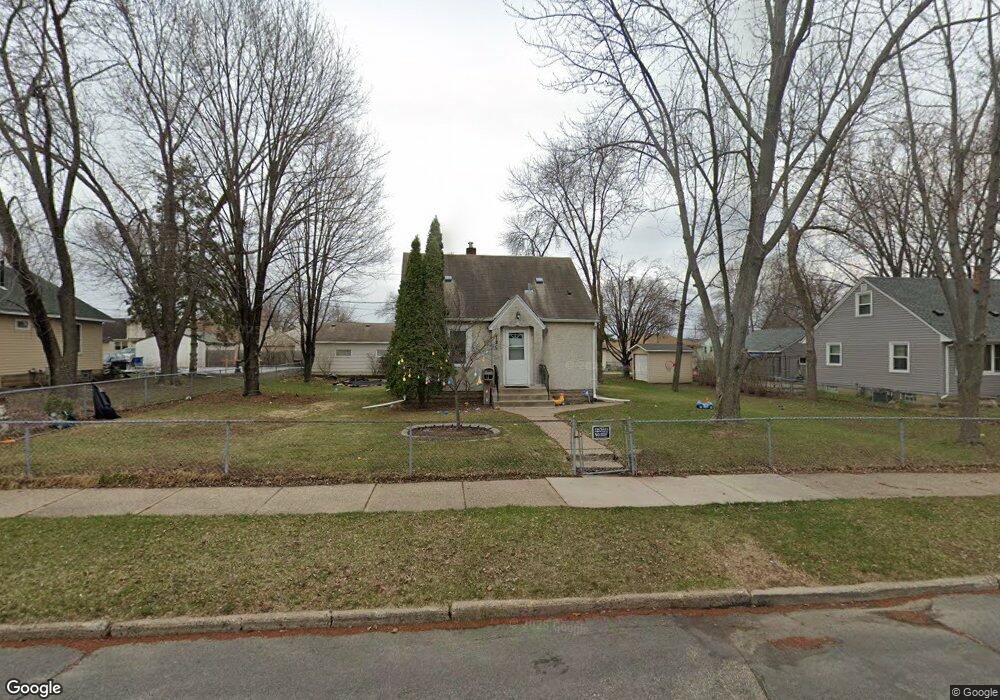
120 Macarthur St E South Saint Paul, MN 55075
Estimated Value: $247,000 - $286,000
3
Beds
1
Bath
720
Sq Ft
$378/Sq Ft
Est. Value
About This Home
This home is located at 120 Macarthur St E, South Saint Paul, MN 55075 and is currently estimated at $272,132, approximately $377 per square foot. 120 Macarthur St E is a home located in Dakota County with nearby schools including Kaposia Education Center Elementary, South St. Paul Secondary, and Discovery Charter School.
Ownership History
Date
Name
Owned For
Owner Type
Purchase Details
Closed on
Jul 23, 2018
Sold by
Harrison Caitlin J
Bought by
Pluff Angela
Current Estimated Value
Home Financials for this Owner
Home Financials are based on the most recent Mortgage that was taken out on this home.
Original Mortgage
$195,261
Outstanding Balance
$170,279
Interest Rate
4.5%
Mortgage Type
Stand Alone First
Estimated Equity
$92,267
Purchase Details
Closed on
Aug 30, 2013
Sold by
Maternowski Darrel and Maternowski Ethel E
Bought by
Harrison Caitlin J
Home Financials for this Owner
Home Financials are based on the most recent Mortgage that was taken out on this home.
Original Mortgage
$137,350
Interest Rate
3.87%
Mortgage Type
FHA
Purchase Details
Closed on
Jan 11, 2013
Sold by
Thompson Douglas Lee
Bought by
Maternowski Darrel and Maternowski Ethel E
Create a Home Valuation Report for This Property
The Home Valuation Report is an in-depth analysis detailing your home's value as well as a comparison with similar homes in the area
Home Values in the Area
Average Home Value in this Area
Purchase History
| Date | Buyer | Sale Price | Title Company |
|---|---|---|---|
| Pluff Angela | $201,300 | Edina Realty Title Inc | |
| Harrison Caitlin J | $139,900 | Title & Closing Inc | |
| Maternowski Darrel | $125,500 | Midwest Guaranty Title Co |
Source: Public Records
Mortgage History
| Date | Status | Borrower | Loan Amount |
|---|---|---|---|
| Open | Pluff Angela | $195,261 | |
| Closed | Pluff Angela | $195,261 | |
| Previous Owner | Harrison Caitlin J | $137,350 |
Source: Public Records
Tax History Compared to Growth
Tax History
| Year | Tax Paid | Tax Assessment Tax Assessment Total Assessment is a certain percentage of the fair market value that is determined by local assessors to be the total taxable value of land and additions on the property. | Land | Improvement |
|---|---|---|---|---|
| 2024 | $3,396 | $254,800 | $107,900 | $146,900 |
| 2023 | $3,396 | $254,200 | $108,500 | $145,700 |
| 2022 | $2,734 | $249,100 | $108,500 | $140,600 |
| 2021 | $2,664 | $212,200 | $94,300 | $117,900 |
| 2020 | $2,536 | $203,800 | $89,800 | $114,000 |
| 2019 | $2,277 | $199,700 | $85,500 | $114,200 |
| 2018 | $2,389 | $175,500 | $77,800 | $97,700 |
| 2017 | $2,111 | $166,800 | $74,100 | $92,700 |
| 2016 | $1,866 | $152,200 | $67,400 | $84,800 |
| 2015 | $1,760 | $117,104 | $53,094 | $64,010 |
| 2014 | -- | $117,213 | $53,106 | $64,107 |
| 2013 | -- | $98,356 | $44,592 | $53,764 |
Source: Public Records
Map
Nearby Homes
- 137 South St E
- 101 Frost St W
- 1436 5th Ave S
- 233 Richmond St W
- 100 W Warburton St
- 1456 6th Ave S
- 1403 Concord St S Unit 1
- 1215 8th Ave S
- 151 Park St W
- 1434 8th Ave S
- 1127 9th Ave S
- 5472 Bryce Ave
- 6050 Cahill Ave
- 928 8th Ave S
- 5938 Burke Trail
- 5903 Bryant Ln
- 6051 Concord Blvd
- 5870 Blackberry Bridge Path
- 6445 Coryell Ct
- 4020 64th St E
- 112 Macarthur St E
- 130 Macarthur St E
- 120 120 MacArthur-street-e
- 120 120 MacArthur St E
- 108 Macarthur St E
- 119 Poplar St E
- 104 Macarthur St E
- 127 Poplar St E
- 111 Poplar St E
- 135 Poplar St E
- 111 111 MacArthur-street-e
- 119 Macarthur St E
- 100 Macarthur St E
- 100 Macarthur St E
- 121 Macarthur St E
- 136 Macarthur St E
- 111 Macarthur St E
- 137 Poplar St E
- 131 Macarthur St E
- 105 105 MacArthur St E