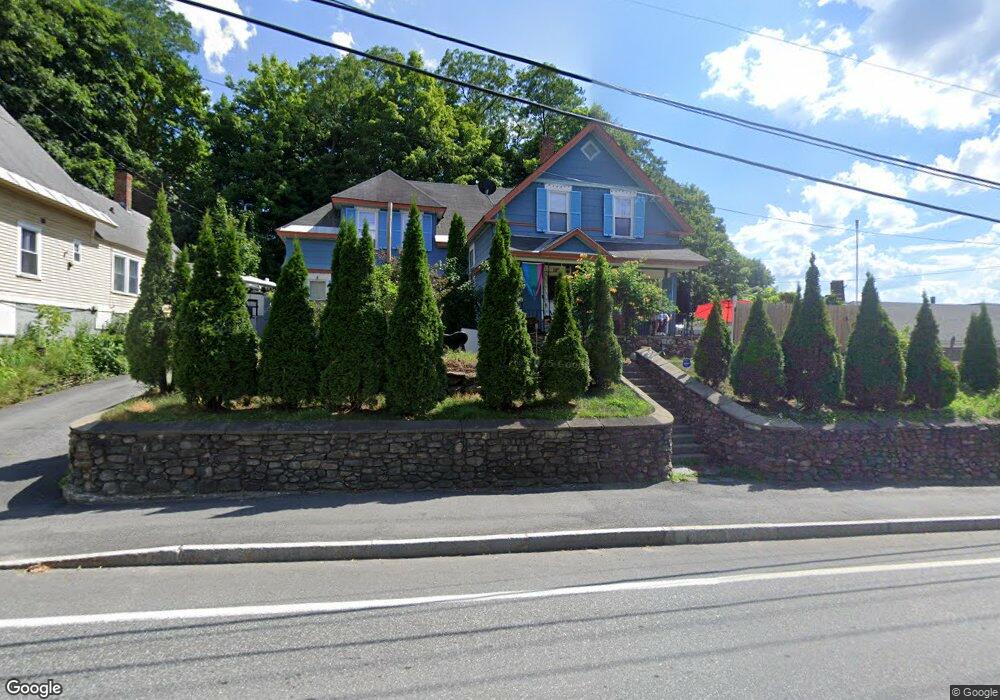
120 Main St Claremont, NH 03743
Estimated Value: $142,000 - $310,000
4
Beds
2
Baths
2,246
Sq Ft
$112/Sq Ft
Est. Value
About This Home
This home is located at 120 Main St, Claremont, NH 03743 and is currently estimated at $250,592, approximately $111 per square foot. 120 Main St is a home located in Sullivan County with nearby schools including Bluff School, Claremont Middle School, and Stevens High School.
Ownership History
Date
Name
Owned For
Owner Type
Purchase Details
Closed on
Sep 14, 2009
Sold by
Hsbc Mortgage Svcs Inc
Bought by
Ohearne Andrew S and Reed James P
Current Estimated Value
Purchase Details
Closed on
Oct 28, 2008
Sold by
Shevett Philip
Bought by
Hsbc Mortgage Svcs Inc
Purchase Details
Closed on
Sep 29, 1999
Sold by
Laramie Matthew R
Bought by
Shevett Philip
Home Financials for this Owner
Home Financials are based on the most recent Mortgage that was taken out on this home.
Original Mortgage
$67,000
Interest Rate
7.85%
Purchase Details
Closed on
Mar 29, 1996
Sold by
Girar Carol E and Girard Thomas
Bought by
Laramie Matthew R
Home Financials for this Owner
Home Financials are based on the most recent Mortgage that was taken out on this home.
Original Mortgage
$55,879
Interest Rate
6.9%
Create a Home Valuation Report for This Property
The Home Valuation Report is an in-depth analysis detailing your home's value as well as a comparison with similar homes in the area
Home Values in the Area
Average Home Value in this Area
Purchase History
| Date | Buyer | Sale Price | Title Company |
|---|---|---|---|
| Ohearne Andrew S | $48,000 | -- | |
| Hsbc Mortgage Svcs Inc | $120,500 | -- | |
| Shevett Philip | $60,000 | -- | |
| Laramie Matthew R | $57,000 | -- |
Source: Public Records
Mortgage History
| Date | Status | Borrower | Loan Amount |
|---|---|---|---|
| Open | Laramie Matthew R | $100,000 | |
| Previous Owner | Laramie Matthew R | $67,000 | |
| Previous Owner | Laramie Matthew R | $55,879 |
Source: Public Records
Tax History Compared to Growth
Tax History
| Year | Tax Paid | Tax Assessment Tax Assessment Total Assessment is a certain percentage of the fair market value that is determined by local assessors to be the total taxable value of land and additions on the property. | Land | Improvement |
|---|---|---|---|---|
| 2024 | $5,284 | $180,600 | $15,300 | $165,300 |
| 2023 | $5,021 | $180,600 | $15,300 | $165,300 |
| 2022 | $4,381 | $105,100 | $10,400 | $94,700 |
| 2021 | $4,307 | $105,100 | $10,400 | $94,700 |
| 2020 | $4,280 | $105,100 | $10,400 | $94,700 |
| 2019 | $4,428 | $105,100 | $10,400 | $94,700 |
| 2018 | $4,581 | $97,800 | $10,400 | $87,400 |
| 2017 | $4,297 | $97,800 | $10,400 | $87,400 |
| 2016 | $4,168 | $97,800 | $10,400 | $87,400 |
| 2015 | $4,056 | $97,800 | $10,400 | $87,400 |
| 2014 | $4,042 | $97,800 | $10,400 | $87,400 |
| 2013 | $5,213 | $143,800 | $20,200 | $123,600 |
Source: Public Records
Map
Nearby Homes