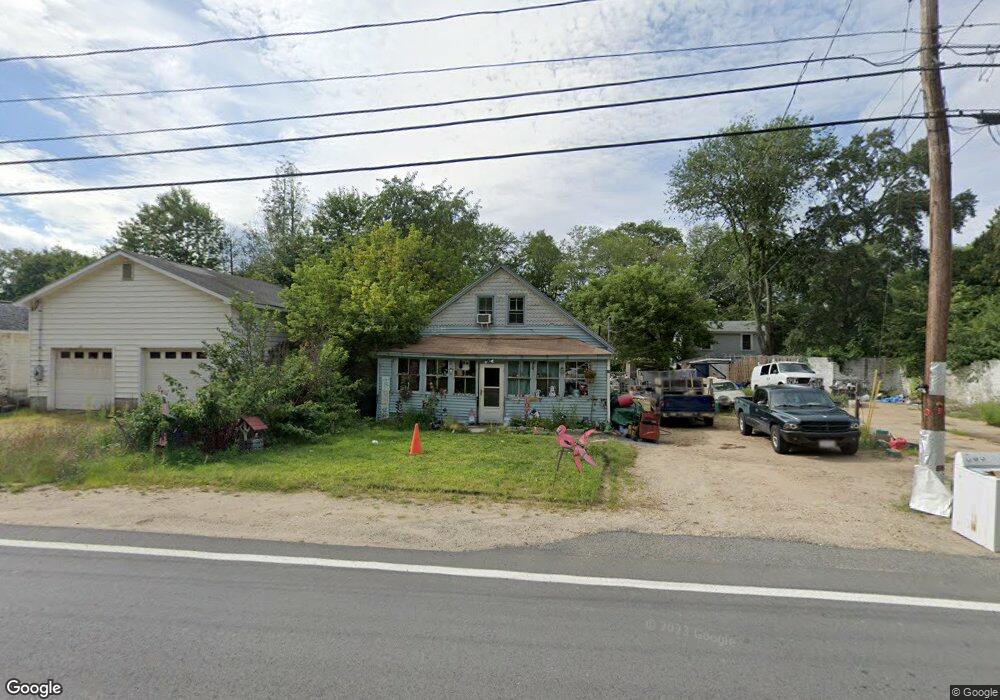
120 Main St South Barre, MA 01074
Estimated Value: $169,000 - $315,000
3
Beds
1
Bath
1,253
Sq Ft
$175/Sq Ft
Est. Value
About This Home
This home is located at 120 Main St, South Barre, MA 01074 and is currently estimated at $219,874, approximately $175 per square foot. 120 Main St is a home located in Worcester County with nearby schools including Quabbin Regional Middle School and Quabbin Regional High School.
Ownership History
Date
Name
Owned For
Owner Type
Purchase Details
Closed on
Sep 22, 2003
Sold by
Citibank
Bought by
Elliot John P
Current Estimated Value
Home Financials for this Owner
Home Financials are based on the most recent Mortgage that was taken out on this home.
Original Mortgage
$78,850
Outstanding Balance
$36,459
Interest Rate
6.31%
Mortgage Type
Purchase Money Mortgage
Estimated Equity
$183,415
Purchase Details
Closed on
Jun 12, 2003
Sold by
Lind James A and Chase Manhattan Mtg Co
Bought by
Citibank
Create a Home Valuation Report for This Property
The Home Valuation Report is an in-depth analysis detailing your home's value as well as a comparison with similar homes in the area
Home Values in the Area
Average Home Value in this Area
Purchase History
| Date | Buyer | Sale Price | Title Company |
|---|---|---|---|
| Elliot John P | $83,000 | -- | |
| Citibank | $80,023 | -- | |
| Elliot John P | $83,000 | -- | |
| Citibank | $80,023 | -- |
Source: Public Records
Mortgage History
| Date | Status | Borrower | Loan Amount |
|---|---|---|---|
| Open | Elliot John P | $78,850 | |
| Closed | Citibank | $78,850 | |
| Previous Owner | Citibank | $70,000 | |
| Previous Owner | Citibank | $63,200 |
Source: Public Records
Tax History Compared to Growth
Tax History
| Year | Tax Paid | Tax Assessment Tax Assessment Total Assessment is a certain percentage of the fair market value that is determined by local assessors to be the total taxable value of land and additions on the property. | Land | Improvement |
|---|---|---|---|---|
| 2025 | $2,622 | $192,900 | $34,500 | $158,400 |
| 2024 | $2,570 | $183,800 | $32,900 | $150,900 |
| 2023 | $2,441 | $153,900 | $25,600 | $128,300 |
| 2022 | $2,230 | $132,400 | $22,000 | $110,400 |
| 2021 | $2,101 | $116,700 | $22,000 | $94,700 |
| 2020 | $2,023 | $113,200 | $22,000 | $91,200 |
| 2019 | $2,035 | $112,300 | $20,000 | $92,300 |
| 2018 | $2,021 | $107,500 | $20,000 | $87,500 |
| 2017 | $1,939 | $103,700 | $20,000 | $83,700 |
| 2016 | $1,794 | $100,800 | $18,100 | $82,700 |
| 2015 | $1,864 | $100,000 | $22,100 | $77,900 |
| 2014 | $1,612 | $100,400 | $27,500 | $72,900 |
Source: Public Records
Map
Nearby Homes
- 120 South St Unit MAIN
- 128 Main St S
- 108 Main St S Unit 2
- 108 Main St S Unit 9
- 108 Main St S
- 108 Main St S Unit B
- 108 Main St S Unit C
- 130 Main St S
- 106 Main St S
- 134 Main St S
- 134 South St Unit MAIN
- 132 Main St
- 100 Main St Unit 1
- 100 Main St Unit 2
- 132 Main St
- 100 Main St
- 92 Main St Unit 2
- 90 Main St
- 164 Main St
- 164 - 166 Main St