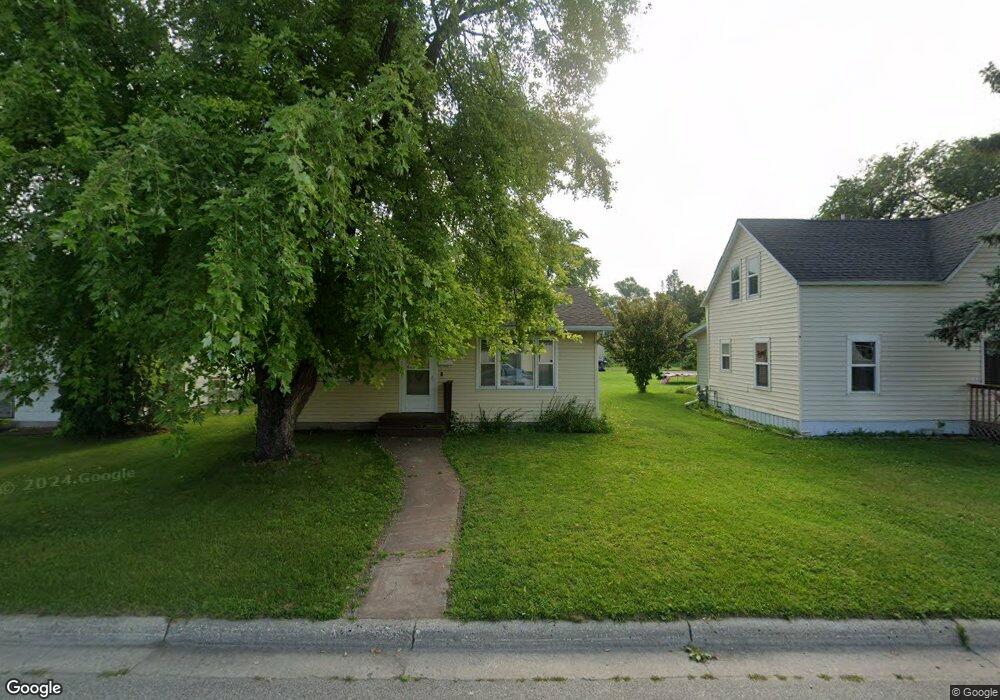
120 Maple Ave N Thief River Falls, MN 56701
Estimated Value: $132,651 - $149,000
Studio
--
Bath
--
Sq Ft
6,360
Sq Ft Lot
About This Home
This home is located at 120 Maple Ave N, Thief River Falls, MN 56701 and is currently estimated at $141,913. 120 Maple Ave N is a home located in Pennington County with nearby schools including Challenger Elementary School, Franklin Middle School, and Lincoln Senior High School.
Ownership History
Date
Name
Owned For
Owner Type
Purchase Details
Closed on
Jul 15, 2022
Sold by
Sturgeon and Nancy
Bought by
Moldaschel Marcus C
Current Estimated Value
Purchase Details
Closed on
Aug 26, 2021
Sold by
Kiamar Joan
Bought by
Sturgeon Brian and Sturgeon Nancy
Purchase Details
Closed on
Jul 29, 2013
Sold by
Gallagher Andrew M and Gallagher Kalynn
Bought by
Klamar Joan M
Home Financials for this Owner
Home Financials are based on the most recent Mortgage that was taken out on this home.
Original Mortgage
$94,897
Interest Rate
3.93%
Mortgage Type
New Conventional
Purchase Details
Closed on
Apr 29, 2007
Sold by
Norby Virgene F
Bought by
Gallagher Andrew M
Home Financials for this Owner
Home Financials are based on the most recent Mortgage that was taken out on this home.
Original Mortgage
$50,000
Interest Rate
5.05%
Mortgage Type
New Conventional
Create a Home Valuation Report for This Property
The Home Valuation Report is an in-depth analysis detailing your home's value as well as a comparison with similar homes in the area
Home Values in the Area
Average Home Value in this Area
Purchase History
| Date | Buyer | Sale Price | Title Company |
|---|---|---|---|
| Moldaschel Marcus C | $134,848 | Delray Sparby Ihle Sparby & Ha | |
| Sturgeon Brian | $124,000 | None Available | |
| Sturgeon Brian | -- | Kaase Nathan | |
| Klamar Joan M | $93,000 | None Available | |
| Gallagher Andrew M | $67,500 | None Available | |
| Sturgeon Brian Brian | $124,000 | -- |
Source: Public Records
Mortgage History
| Date | Status | Borrower | Loan Amount |
|---|---|---|---|
| Previous Owner | Klamar Joan M | $94,897 | |
| Previous Owner | Gallagher Andrew M | $50,000 |
Source: Public Records
Tax History
| Year | Tax Paid | Tax Assessment Tax Assessment Total Assessment is a certain percentage of the fair market value that is determined by local assessors to be the total taxable value of land and additions on the property. | Land | Improvement |
|---|---|---|---|---|
| 2024 | $2,116 | $124,900 | $16,000 | $108,900 |
| 2023 | $1,952 | $124,900 | $0 | $0 |
| 2022 | $1,516 | $115,500 | $0 | $0 |
| 2021 | $1,438 | $105,400 | $0 | $0 |
| 2020 | $1,328 | $100,400 | $0 | $0 |
| 2019 | $1,270 | $97,200 | $0 | $0 |
| 2018 | $1,252 | $97,200 | $0 | $0 |
| 2017 | $1,192 | $95,900 | $0 | $0 |
| 2016 | $1,132 | $91,900 | $0 | $0 |
| 2014 | $1,008 | $80,000 | $0 | $0 |
| 2013 | $1,046 | $78,000 | $0 | $0 |
Source: Public Records
Map
Nearby Homes
- 225 Kneale Ave N
- 240 Kneale Ave N
- 245 Kneale Ave N
- 308 Maple Ave S
- 305 Kneale Ave N
- 1217 Taft St E
- 241 Crocker Ave N
- 414 Crocker Ave S
- 335 Crocker Ave N
- 321 Tindolph Ave N
- 211 Kendall Ave N
- 310 Kendall Ave N
- 1509 Meadowlark Ct
- 111 Markley Ave S
- 310 Saint Paul Ave S
- 106 Breezy Dr
- 302 Sherwood Ave N
- 131 Belleville Ct
- 622 Saint Paul Ave S
- 820 Tindolph Ave S
- 122 Maple Ave N
- 114 Maple Ave N
- 110 Maple Ave N
- 125 Spruce Ave N
- 113 Spruce Ave N
- 204 Maple Ave N
- 1303 1st St E
- 113 Maple Ave N
- 113 113 Maple Ave N
- 115 Maple Ave N
- 109 Maple Ave N
- 206 Maple Ave N
- 1305 1st St E
- 201 Spruce Ave N
- 205 Spruce Ave N
- 205 Maple Ave N
- 214 Maple Ave N
- 118 Spruce Ave N
- 104 Maple Ave S
- 1411 1st St E
Your Personal Tour Guide
Ask me questions while you tour the home.