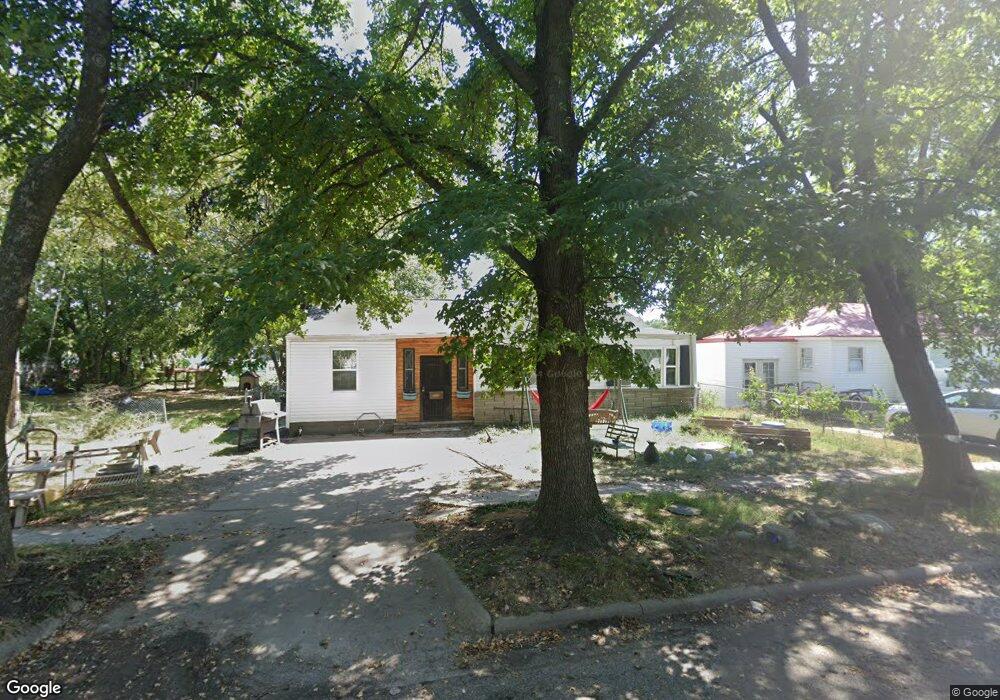
120 N Elm St Commerce, OK 74339
Estimated Value: $67,000 - $89,214
3
Beds
2
Baths
1,272
Sq Ft
$60/Sq Ft
Est. Value
About This Home
This home is located at 120 N Elm St, Commerce, OK 74339 and is currently estimated at $76,054, approximately $59 per square foot. 120 N Elm St is a home located in Ottawa County with nearby schools including Alexander Elementary School, Commerce Middle School, and Commerce High School.
Ownership History
Date
Name
Owned For
Owner Type
Purchase Details
Closed on
Aug 6, 2021
Sold by
Harter Carrie A
Bought by
Zuniga Mendlela X and Zuniga Maria
Current Estimated Value
Purchase Details
Closed on
Oct 29, 2020
Sold by
City Of Commerce
Bought by
Harter Daniel R and Harter Carrie
Purchase Details
Closed on
May 14, 2018
Sold by
Williams Corey and Williams Amber
Bought by
Harter Daniel R and Harter Carrie
Home Financials for this Owner
Home Financials are based on the most recent Mortgage that was taken out on this home.
Original Mortgage
$36,375
Interest Rate
4.44%
Mortgage Type
New Conventional
Purchase Details
Closed on
Apr 17, 2014
Bought by
Williams Crystal J and Williams Corey,
Purchase Details
Closed on
Sep 22, 1994
Bought by
Williams Terry M
Purchase Details
Closed on
Aug 15, 1989
Bought by
Southern Helenclair
Create a Home Valuation Report for This Property
The Home Valuation Report is an in-depth analysis detailing your home's value as well as a comparison with similar homes in the area
Purchase History
We collect this data history from publicly available records. To have your information removed, we recommend requesting removal directly through your county’s website.
| Date | Buyer | Sale Price | Title Company |
|---|---|---|---|
| Zuniga Mendlela X | -- | None Available | |
| Harter Daniel R | -- | None Available | |
| Harter Daniel R | $37,500 | Photo Abstract Co | |
| Williams Corey | -- | Photo Abstract Co | |
| Williams Crystal J | $10,000 | -- | |
| Williams Terry M | -- | -- | |
| Southern Helenclair | -- | -- |
Source: Public Records
Mortgage History
We collect this data history from publicly available records. To have your information removed, we recommend requesting removal directly through your county’s website.
| Date | Status | Borrower | Loan Amount |
|---|---|---|---|
| Previous Owner | Harter Daniel R | $36,375 |
Source: Public Records
Tax History
| Year | Tax Paid | Tax Assessment Tax Assessment Total Assessment is a certain percentage of the fair market value that is determined by local assessors to be the total taxable value of land and additions on the property. | Land | Improvement |
|---|---|---|---|---|
| 2025 | $335 | $4,452 | $524 | $3,928 |
| 2024 | $370 | $4,811 | $524 | $4,287 |
| 2023 | $370 | $4,671 | $524 | $4,147 |
| 2022 | $323 | $4,535 | $524 | $4,011 |
| 2021 | $316 | $4,403 | $524 | $3,879 |
| 2020 | $401 | $4,275 | $638 | $3,637 |
| 2019 | $412 | $4,275 | $638 | $3,637 |
| 2018 | $143 | $2,485 | $416 | $2,069 |
| 2017 | $136 | $2,414 | $406 | $2,008 |
| 2016 | $130 | $2,342 | $401 | $1,941 |
| 2015 | $146 | $2,144 | $216 | $1,928 |
| 2014 | $91 | $2,275 | $390 | $1,885 |
Source: Public Records
Map
Nearby Homes
- 123 N Mickey Mantle Blvd
- 118 N Elm St
- 124 N Elm St
- 127 N Mickey Mantle Blvd
- 114 N Elm St
- 119 N Mickey Mantle Blvd
- 112 N Elm St
- 117 N Mickey Mantle Blvd
- 202 N Elm St
- 110 N Elm St
- 204 N Elm St
- 108 N Elm St
- 201 N Mickey Mantle Blvd
- 124 N Mickey Mantle Blvd
- 128 N Mickey Mantle Blvd
- 206 N Elm St
- 113 N Elm St
- 112 N Cedar St
- 104 N Elm St
- 122 N Cedar St
Your Personal Tour Guide
Ask me questions while you tour the home.