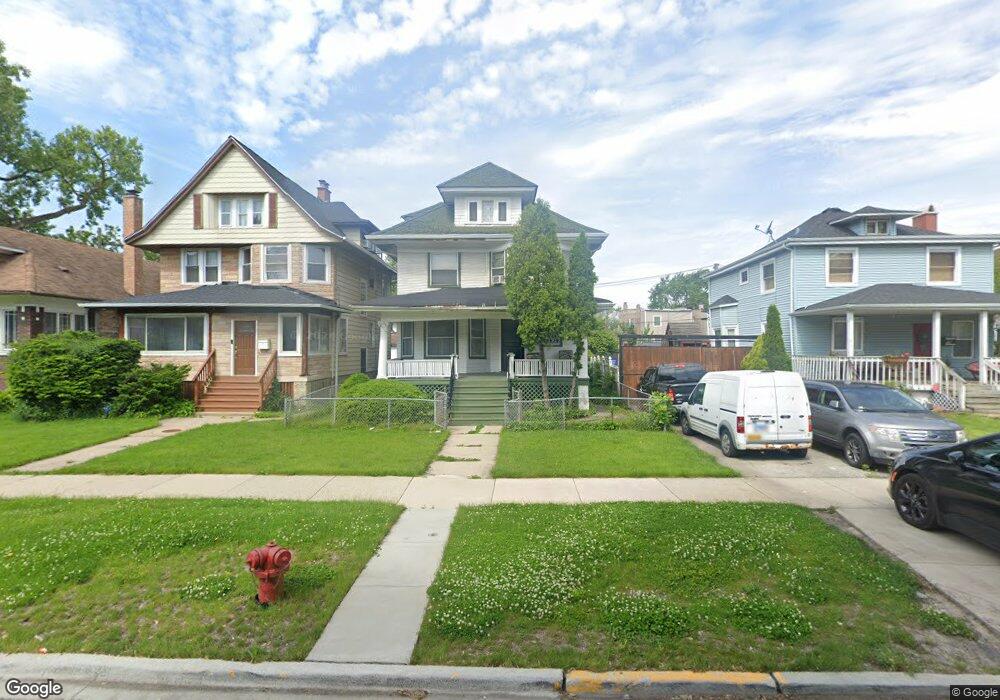
120 N Lorel Ave Chicago, IL 60644
Austin NeighborhoodEstimated Value: $197,213 - $255,000
3
Beds
2
Baths
1,608
Sq Ft
$142/Sq Ft
Est. Value
About This Home
This home is located at 120 N Lorel Ave, Chicago, IL 60644 and is currently estimated at $227,803, approximately $141 per square foot. 120 N Lorel Ave is a home located in Cook County with nearby schools including Ellington Elementary School, Catalyst Charter-Circle Rock Elementary School, and KIPP Academy Chicago Campus.
Ownership History
Date
Name
Owned For
Owner Type
Purchase Details
Closed on
Jan 20, 2025
Sold by
Jones Jennifer Denise
Bought by
Jones Rs
Current Estimated Value
Purchase Details
Closed on
Aug 19, 2024
Sold by
Jones Esther
Bought by
Jones Rs and Jones Jennifer Denise
Purchase Details
Closed on
Jan 9, 1996
Sold by
The Chicago Trust Company
Bought by
Jones Esther
Create a Home Valuation Report for This Property
The Home Valuation Report is an in-depth analysis detailing your home's value as well as a comparison with similar homes in the area
Home Values in the Area
Average Home Value in this Area
Purchase History
| Date | Buyer | Sale Price | Title Company |
|---|---|---|---|
| Jones Rs | -- | None Listed On Document | |
| Jones Rs | -- | None Listed On Document | |
| Jones Esther | -- | -- |
Source: Public Records
Tax History
| Year | Tax Paid | Tax Assessment Tax Assessment Total Assessment is a certain percentage of the fair market value that is determined by local assessors to be the total taxable value of land and additions on the property. | Land | Improvement |
|---|---|---|---|---|
| 2025 | $1,688 | $17,200 | $6,300 | $10,900 |
| 2024 | $1,688 | $17,200 | $6,300 | $10,900 |
| 2023 | $1,646 | $8,000 | $4,020 | $3,980 |
| 2022 | $1,646 | $8,000 | $4,020 | $3,980 |
| 2021 | $1,609 | $8,001 | $4,021 | $3,980 |
| 2020 | $3,307 | $14,845 | $4,462 | $10,383 |
| 2019 | $3,314 | $16,495 | $4,462 | $12,033 |
| 2018 | $3,258 | $16,495 | $4,462 | $12,033 |
| 2017 | $2,950 | $13,703 | $3,937 | $9,766 |
| 2016 | $0 | $13,703 | $3,937 | $9,766 |
| 2015 | $0 | $13,703 | $3,937 | $9,766 |
| 2014 | -- | $13,042 | $3,675 | $9,367 |
| 2013 | -- | $13,042 | $3,675 | $9,367 |
Source: Public Records
Map
Nearby Homes
- 169 N Lorel Ave
- 206 N Lockwood Ave
- 118 N Long Ave
- 144 N Laramie Ave
- 306 N Lockwood Ave
- 139 N Laramie Ave
- 1100 S Menard St
- 4855 W Jackson Blvd
- 351 - 355 S Cicero Ave
- 206 N Leamington Ave
- 4607 W Madison St
- 212 N Leamington Ave
- 217 N Leamington Ave
- 174 N Leclaire Ave
- 332 N Lorel Ave
- 5037 W West End Ave
- 5500 W Adams St
- 46 N Central Ave
- 5317 W Ferdinand St
- 5033 W Washington Blvd
- 118 N Lorel Ave
- 126 N Lorel Ave
- 114 N Lorel Ave
- 130 N Lorel Ave
- 130 N Lorel Ave
- 136 N Lorel Ave
- 123 N Long Ave
- 119 N Long Ave
- 5340 W Washington Blvd
- 5344 W Washington Blvd
- 117 N Long Ave
- 5348 W Washington Blvd
- 129 N Long Ave
- 129 N Long Ave
- 127 N Lorel Ave
- 133 N Long Ave
- 131 N Lorel Ave
- 125 N Lorel Ave
- 119 N Lorel Ave
- 142 N Lorel Ave
Your Personal Tour Guide
Ask me questions while you tour the home.