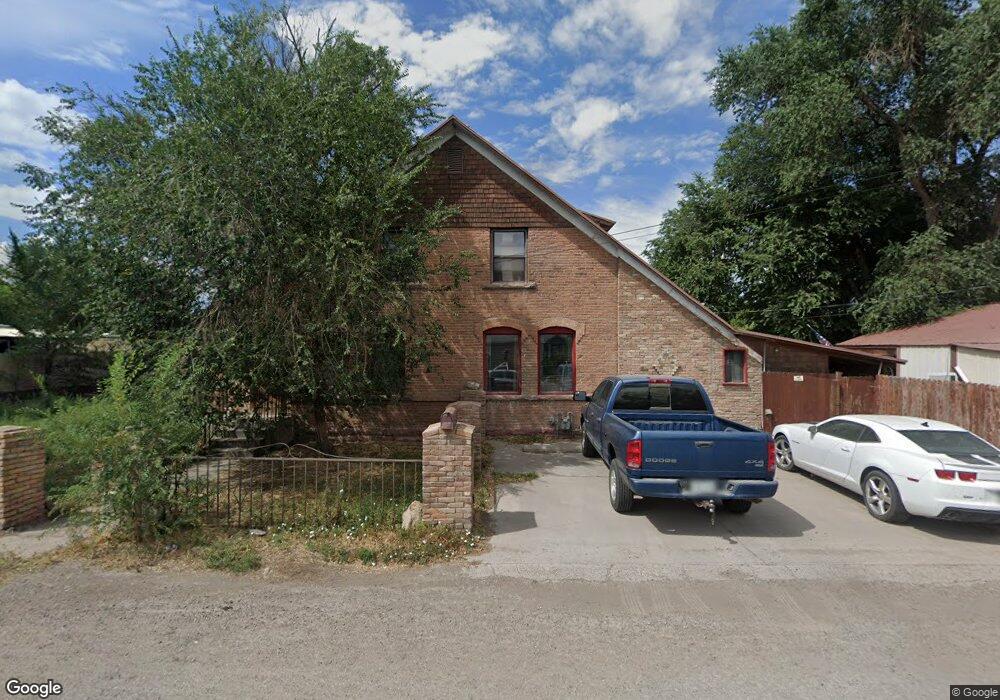
120 N Maple Ave Montrose, CO 81401
Estimated Value: $391,000 - $509,000
3
Beds
2
Baths
2,210
Sq Ft
$203/Sq Ft
Est. Value
About This Home
This home is located at 120 N Maple Ave, Montrose, CO 81401 and is currently estimated at $448,157, approximately $202 per square foot. 120 N Maple Ave is a home located in Montrose County with nearby schools including Northside Elementary School, Centennial Middle School, and Montrose High School.
Ownership History
Date
Name
Owned For
Owner Type
Purchase Details
Closed on
Aug 2, 2012
Sold by
Gladwell Donald R and Gladwell Janice K
Bought by
Bishop Clark Bryant and Bishop Tracey Ann
Current Estimated Value
Home Financials for this Owner
Home Financials are based on the most recent Mortgage that was taken out on this home.
Original Mortgage
$265,372
Outstanding Balance
$183,924
Interest Rate
3.68%
Estimated Equity
$264,233
Purchase Details
Closed on
Feb 17, 2004
Sold by
West Main Trailer Park Llc
Bought by
Gladwell Donald R and Gladwell Janice K
Purchase Details
Closed on
Nov 13, 2002
Sold by
Wright Ronald L and Wright Olga M
Bought by
Gladwell Donald R and Gladwell Janice K
Purchase Details
Closed on
Dec 13, 2001
Sold by
Jones Sherman D and Jones Norma M Joint Li
Bought by
West Main Trailer Park Llc
Purchase Details
Closed on
Jun 30, 1994
Sold by
Griffin Janice E
Bought by
Jones Sherman D and Jones Norma M Joint Li
Purchase Details
Closed on
Feb 8, 1980
Sold by
Griffin Rufus Charles
Bought by
Griffin Janice E
Create a Home Valuation Report for This Property
The Home Valuation Report is an in-depth analysis detailing your home's value as well as a comparison with similar homes in the area
Home Values in the Area
Average Home Value in this Area
Purchase History
| Date | Buyer | Sale Price | Title Company |
|---|---|---|---|
| Bishop Clark Bryant | $212,500 | None Available | |
| Gladwell Donald R | -- | -- | |
| Gladwell Donald R | -- | -- | |
| West Main Trailer Park Llc | -- | -- | |
| Jones Sherman D | $415,000 | -- | |
| Griffin Janice E | -- | -- |
Source: Public Records
Mortgage History
| Date | Status | Borrower | Loan Amount |
|---|---|---|---|
| Open | Bishop Clark Bryant | $265,372 |
Source: Public Records
Tax History Compared to Growth
Tax History
| Year | Tax Paid | Tax Assessment Tax Assessment Total Assessment is a certain percentage of the fair market value that is determined by local assessors to be the total taxable value of land and additions on the property. | Land | Improvement |
|---|---|---|---|---|
| 2024 | $1,670 | $23,460 | $3,330 | $20,130 |
| 2023 | $1,670 | $28,160 | $4,000 | $24,160 |
| 2022 | $1,314 | $19,100 | $2,800 | $16,300 |
| 2021 | $1,355 | $19,650 | $2,880 | $16,770 |
| 2020 | $1,124 | $16,760 | $2,380 | $14,380 |
| 2019 | $1,132 | $16,760 | $2,380 | $14,380 |
| 2018 | $923 | $13,340 | $1,920 | $11,420 |
| 2017 | $916 | $13,340 | $1,920 | $11,420 |
| 2016 | $850 | $12,580 | $1,850 | $10,730 |
| 2015 | $834 | $12,580 | $1,850 | $10,730 |
| 2014 | $790 | $12,740 | $1,850 | $10,890 |
Source: Public Records
Map
Nearby Homes
- 461 W Main St
- 147 E Main St Unit 147 Main , 18 N Se
- 755 Spring Creek Rd & 14750 Marine Rd
- 726 Spring Creek Rd
- 841 N Grand Ave
- 990 Mountain View Ct
- 638 N Cascade Ave
- 512 N 5th St
- 945 N Selig Ave
- TBD Bristlecone Dr
- 11 Bristlecone Dr
- 271 Bristlecone Ct
- 616 S 1st St
- 701 N 4th St
- 1018 Buffalograss Dr
- TBD Mayfly Dr Unit Lot 27
- TBD Mayfly Dr Unit Lot 22
- TBD Mayfly Dr Unit Lot 18
- TBD Mayfly Dr Unit Lot 31
- TBD Mayfly Dr Unit Lot 13
- 245 1st
- 245 W North 1st St
- 239 W North 1st St
- 0 B Rd
- 32 N Maple Ave
- 230 1st
- 0 NW 1st Unit 617068
- W N 1st St
- 229 W North 1st St
- 230 W North 1st St
- 223 W North 1st St
- 226 W North 1st St
- 211 W North 1st St
- 205 W North 1st St
- 214 W North 1st St
- 245 W Main St
- 235 W Main St
- 345 W Main St
- 137 N Willerup Ave
- 233 W Main St