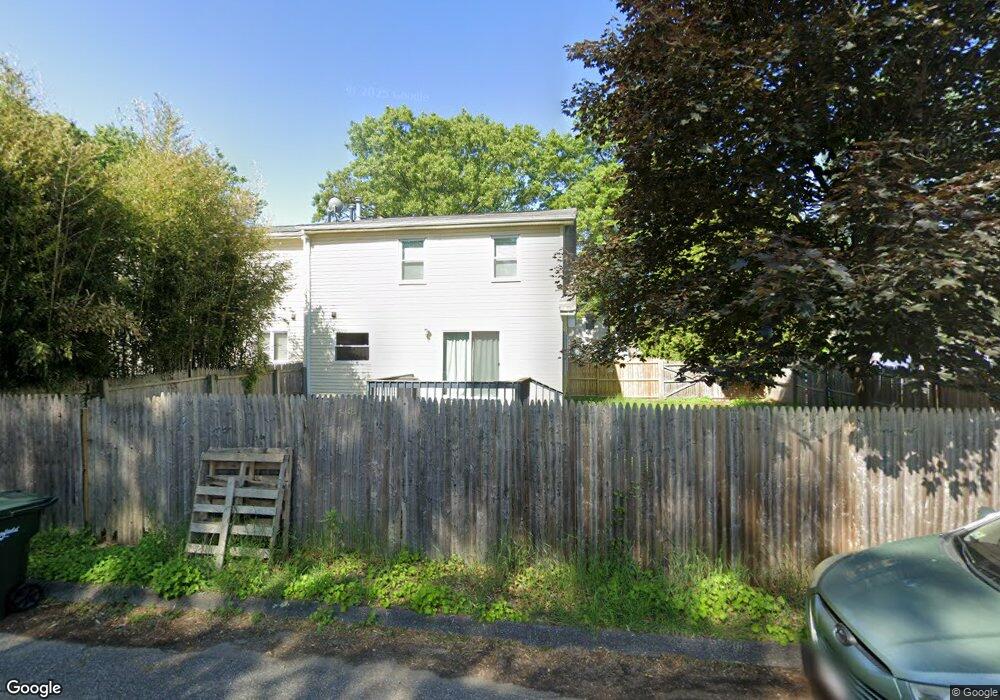
120 Odion St Springfield, MA 01118
East Forest Park NeighborhoodEstimated Value: $269,000 - $294,000
2
Beds
2
Baths
1,050
Sq Ft
$266/Sq Ft
Est. Value
About This Home
This home is located at 120 Odion St, Springfield, MA 01118 and is currently estimated at $279,071, approximately $265 per square foot. 120 Odion St is a home located in Hampden County with nearby schools including Frederick Harris Elementary School, M Marcus Kiley Middle, and Springfield High School of Science and Technology.
Ownership History
Date
Name
Owned For
Owner Type
Purchase Details
Closed on
Apr 5, 2007
Sold by
Starr David A
Bought by
Thornton Jeffrey J
Current Estimated Value
Home Financials for this Owner
Home Financials are based on the most recent Mortgage that was taken out on this home.
Original Mortgage
$130,500
Interest Rate
6.25%
Mortgage Type
Purchase Money Mortgage
Purchase Details
Closed on
Oct 22, 1998
Sold by
Ludean Assocs Lp
Bought by
Starr David A
Home Financials for this Owner
Home Financials are based on the most recent Mortgage that was taken out on this home.
Original Mortgage
$65,250
Interest Rate
6.74%
Mortgage Type
Purchase Money Mortgage
Create a Home Valuation Report for This Property
The Home Valuation Report is an in-depth analysis detailing your home's value as well as a comparison with similar homes in the area
Home Values in the Area
Average Home Value in this Area
Purchase History
| Date | Buyer | Sale Price | Title Company |
|---|---|---|---|
| Thornton Jeffrey J | $145,000 | -- | |
| Starr David A | $64,000 | -- |
Source: Public Records
Mortgage History
| Date | Status | Borrower | Loan Amount |
|---|---|---|---|
| Previous Owner | Thornton Jeffrey J | $130,500 | |
| Previous Owner | Starr David A | $65,250 |
Source: Public Records
Tax History Compared to Growth
Tax History
| Year | Tax Paid | Tax Assessment Tax Assessment Total Assessment is a certain percentage of the fair market value that is determined by local assessors to be the total taxable value of land and additions on the property. | Land | Improvement |
|---|---|---|---|---|
| 2025 | $3,296 | $210,200 | $47,100 | $163,100 |
| 2024 | $3,104 | $193,300 | $47,100 | $146,200 |
| 2023 | $2,974 | $174,400 | $44,800 | $129,600 |
| 2022 | $3,258 | $173,100 | $44,800 | $128,300 |
| 2021 | $2,880 | $152,400 | $40,700 | $111,700 |
| 2020 | $2,639 | $135,100 | $40,700 | $94,400 |
| 2019 | $2,413 | $122,600 | $40,700 | $81,900 |
| 2018 | $2,491 | $126,600 | $40,700 | $85,900 |
| 2017 | $2,809 | $142,900 | $40,700 | $102,200 |
| 2016 | $2,570 | $130,700 | $40,700 | $90,000 |
| 2015 | $2,555 | $129,900 | $40,700 | $89,200 |
Source: Public Records
Map
Nearby Homes
- 80 Tulsa St
- 155 Powell Ave
- 261 W Allen Ridge Rd
- 36 Sunapee St
- 78 Blaine St
- 36 Garland St
- 26 Dwight Rd
- 56 Hadley St
- 13 Bither St
- 77 W Allen Ridge Rd
- 43 Thorndyke St
- 63 Webber St
- 34 Castle St
- 26 Harkness Ave
- 108 Brunswick St
- 157 Canterbury Rd
- 88 Brunswick St
- 19 Roosevelt Ave
- 392 Gifford St
- 16-18 Eddywood St