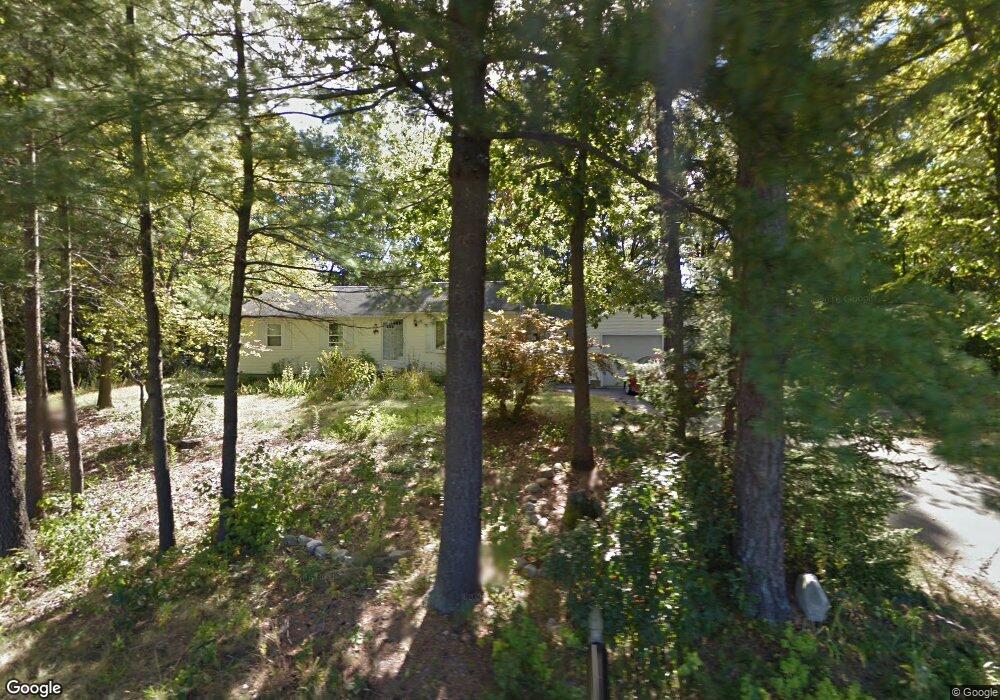
120 Pleasant St Southampton, MA 01073
Estimated Value: $394,041 - $436,000
3
Beds
1
Bath
1,144
Sq Ft
$355/Sq Ft
Est. Value
About This Home
This home is located at 120 Pleasant St, Southampton, MA 01073 and is currently estimated at $406,260, approximately $355 per square foot. 120 Pleasant St is a home located in Hampshire County with nearby schools including William E Norris School, Hilltown Cooperative Charter Public School, and Calvary Baptist Christian School.
Ownership History
Date
Name
Owned For
Owner Type
Purchase Details
Closed on
Feb 17, 2005
Sold by
Canon Robert A
Bought by
Fennell Anthony and Fennell Eliza
Current Estimated Value
Home Financials for this Owner
Home Financials are based on the most recent Mortgage that was taken out on this home.
Original Mortgage
$168,750
Outstanding Balance
$85,942
Interest Rate
5.78%
Mortgage Type
Purchase Money Mortgage
Estimated Equity
$320,318
Purchase Details
Closed on
Oct 29, 2004
Sold by
Quinlan Linda J and Quinlan Thomas E
Bought by
Canon Robert A
Purchase Details
Closed on
Aug 23, 1988
Sold by
Johnson Roy A
Bought by
Quinlan Thomas E
Home Financials for this Owner
Home Financials are based on the most recent Mortgage that was taken out on this home.
Original Mortgage
$58,000
Interest Rate
10.32%
Mortgage Type
Purchase Money Mortgage
Create a Home Valuation Report for This Property
The Home Valuation Report is an in-depth analysis detailing your home's value as well as a comparison with similar homes in the area
Home Values in the Area
Average Home Value in this Area
Purchase History
| Date | Buyer | Sale Price | Title Company |
|---|---|---|---|
| Fennell Anthony | $225,000 | -- | |
| Canon Robert A | $218,500 | -- | |
| Quinlan Thomas E | $148,000 | -- |
Source: Public Records
Mortgage History
| Date | Status | Borrower | Loan Amount |
|---|---|---|---|
| Open | Quinlan Thomas E | $168,750 | |
| Previous Owner | Quinlan Thomas E | $46,700 | |
| Previous Owner | Quinlan Thomas E | $53,000 | |
| Previous Owner | Quinlan Thomas E | $58,000 |
Source: Public Records
Tax History Compared to Growth
Tax History
| Year | Tax Paid | Tax Assessment Tax Assessment Total Assessment is a certain percentage of the fair market value that is determined by local assessors to be the total taxable value of land and additions on the property. | Land | Improvement |
|---|---|---|---|---|
| 2025 | $4,352 | $307,100 | $118,800 | $188,300 |
| 2024 | $4,251 | $298,300 | $118,800 | $179,500 |
| 2023 | $4,008 | $279,700 | $118,800 | $160,900 |
| 2022 | $4,070 | $270,100 | $118,500 | $151,600 |
| 2021 | $4,029 | $252,300 | $111,100 | $141,200 |
| 2020 | $3,946 | $249,400 | $111,100 | $138,300 |
| 2019 | $3,880 | $237,900 | $111,100 | $126,800 |
| 2018 | $3,627 | $216,900 | $99,800 | $117,100 |
| 2017 | $3,540 | $216,900 | $99,800 | $117,100 |
| 2015 | $3,324 | $211,600 | $91,400 | $120,200 |
Source: Public Records
Map
Nearby Homes