120 Powers St Needham, MA 02492
Estimated Value: $1,099,000 - $1,351,703
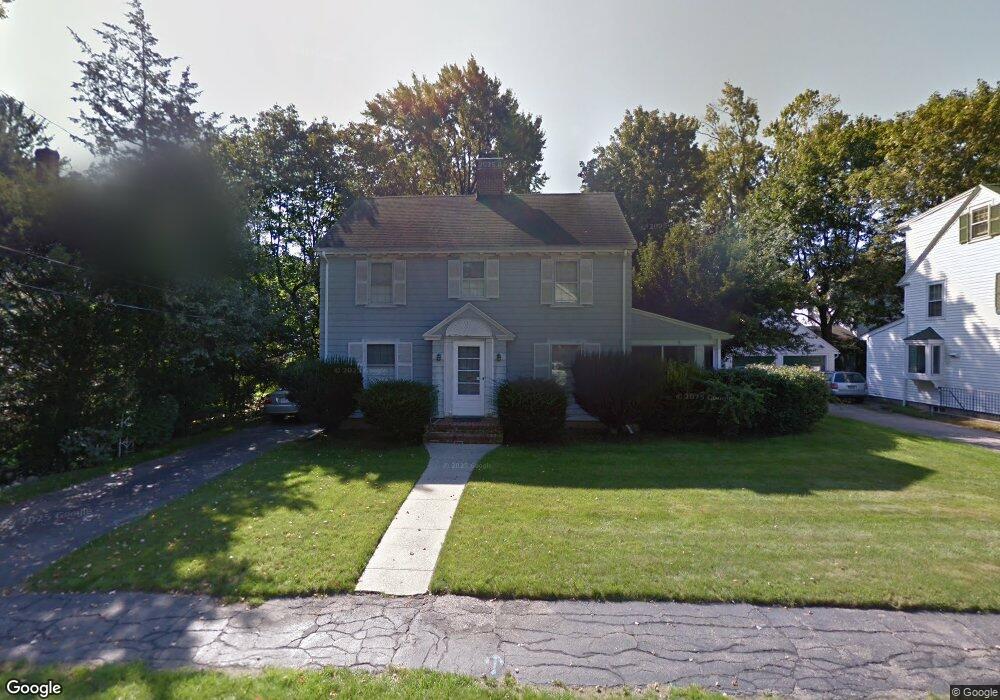
About This Home
This home is located at 120 Powers St, Needham, MA 02492 and is currently estimated at $1,231,176, approximately $1,538 per square foot. 120 Powers St is a home located in Norfolk County with nearby schools including Mitchell Elementary School, High Rock Middle School, and Pollard Middle School.
Ownership History
We collect this data history from publicly available records. To have your information removed, we recommend requesting removal directly through your county’s website.
Purchase Details
Purchase Details
Home Values in the Area
Average Home Value in this Area
Purchase History
We collect this data history from publicly available records. To have your information removed, we recommend requesting removal directly through your county’s website.
| Date | Buyer | Sale Price | Title Company |
|---|---|---|---|
| -- | -- | ||
| $99,000 | -- |
Mortgage History
We collect this data history from publicly available records. To have your information removed, we recommend requesting removal directly through your county’s website.
| Date | Status | Borrower | Loan Amount |
|---|---|---|---|
| Previous Owner | $87,000 | ||
| Previous Owner | $120,000 |
Tax History
We collect this data history from publicly available records. To have your information removed, we recommend requesting removal directly through your county’s website.
| Year | Tax Paid | Tax Assessment Tax Assessment Total Assessment is a certain percentage of the fair market value that is determined by local assessors to be the total taxable value of land and additions on the property. | Land | Improvement |
|---|---|---|---|---|
| 2025 | $10,248 | $966,800 | $797,500 | $169,300 |
| 2024 | $9,554 | $763,100 | $579,200 | $183,900 |
| 2023 | $9,750 | $747,700 | $579,200 | $168,500 |
| 2022 | $9,366 | $700,500 | $536,300 | $164,200 |
| 2021 | $9,128 | $700,500 | $536,300 | $164,200 |
| 2020 | $8,711 | $697,400 | $536,400 | $161,000 |
| 2019 | $7,984 | $644,400 | $487,600 | $156,800 |
| 2018 | $7,655 | $644,400 | $487,600 | $156,800 |
| 2017 | $7,449 | $626,500 | $487,600 | $138,900 |
| 2016 | $7,252 | $628,400 | $487,600 | $140,800 |
| 2015 | $7,095 | $628,400 | $487,600 | $140,800 |
| 2014 | $6,528 | $560,800 | $424,000 | $136,800 |
Map
- 246 Manning St
- 89 Melrose Ave
- 11 Mayo Ave
- 19 Mayo Ave
- 131 Fair Oaks Park
- 36 Upland Rd
- 9 Morley St
- 24 Cleveland Rd
- 277 Brookline St
- 15 Hawthorn Ave
- 42 Hawthorn Ave
- 52 Beaufort Ave
- 490 Webster St
- 98 Falcon St
- 1058 Highland Ave
- 19 Mount Vernon Ave
- 46 Howland St Unit 46
- 100 Rosemary Way Unit 322
- 100 Rosemary Way Unit 206
- 100 Rosemary Way Unit 231
- 126 Powers St
- 114 Powers St
- 728 Webster St
- 63 Parkinson St
- 57 Parkinson St
- 716 Webster St
- 69 Parkinson St
- 113 Powers St
- 77 Parkinson St
- 53 Parkinson St
- 325 Manning St
- 102 Powers St
- 710 Webster St
- 710 Webster St Unit 710
- 710 Webster St Unit 2
- 119 Powers St
- 109 Powers St
- 736 Webster St
- 736 Webster St Unit 1
- 706 Webster St
Ask me questions while you tour the home.