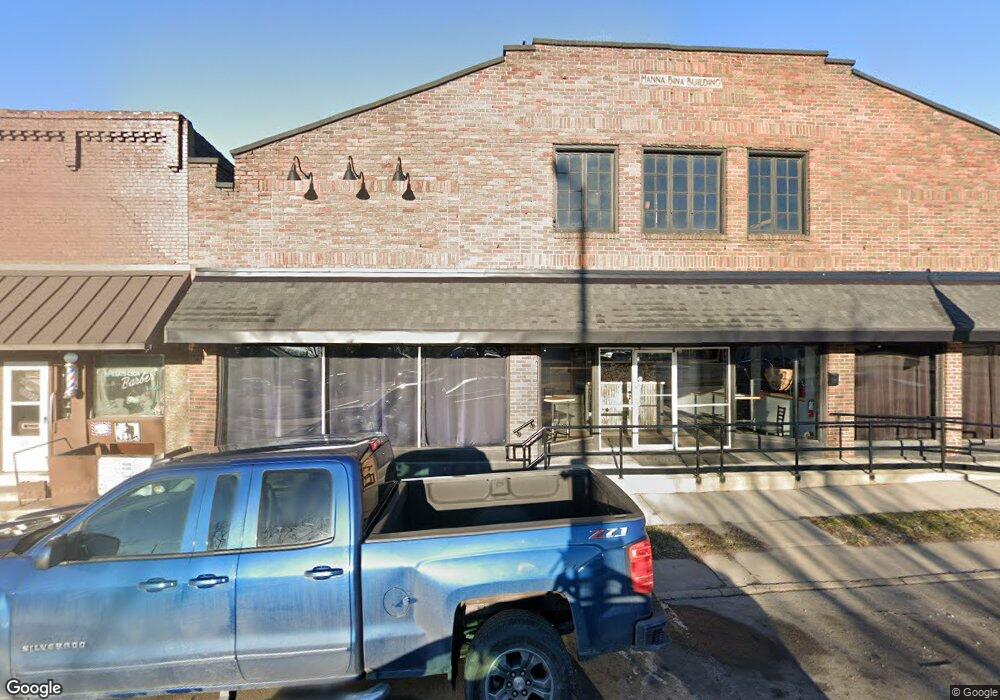
120 S Main St Kenton, OH 43326
Estimated Value: $272,743
--
Bed
--
Bath
7,920
Sq Ft
$34/Sq Ft
Est. Value
About This Home
This home is located at 120 S Main St, Kenton, OH 43326 and is currently estimated at $272,743, approximately $34 per square foot. 120 S Main St is a home located in Hardin County with nearby schools including Kenton Elementary School, Kenton Middle School, and Kenton High School.
Ownership History
Date
Name
Owned For
Owner Type
Purchase Details
Closed on
Feb 19, 2025
Sold by
101 Smokehouse Llc
Bought by
101 Property Holdings Llc
Current Estimated Value
Purchase Details
Closed on
Aug 24, 2020
Sold by
Mendez Bell Group Inc
Bought by
Our Place Family Dinning Llc
Home Financials for this Owner
Home Financials are based on the most recent Mortgage that was taken out on this home.
Original Mortgage
$200,000
Interest Rate
4.5%
Mortgage Type
Land Contract Argmt. Of Sale
Purchase Details
Closed on
Sep 21, 2017
Sold by
Turner Pamela R
Bought by
Mendez Bell Group Inc
Home Financials for this Owner
Home Financials are based on the most recent Mortgage that was taken out on this home.
Original Mortgage
$195,750
Interest Rate
3.89%
Mortgage Type
Construction
Purchase Details
Closed on
Mar 14, 2013
Sold by
Smith Pamela R
Bought by
Smith Pamela R and The Jerry L Smith Credit Shelter Trust
Purchase Details
Closed on
Jan 20, 1999
Bought by
Smith Jerry Trustee
Create a Home Valuation Report for This Property
The Home Valuation Report is an in-depth analysis detailing your home's value as well as a comparison with similar homes in the area
Home Values in the Area
Average Home Value in this Area
Purchase History
| Date | Buyer | Sale Price | Title Company |
|---|---|---|---|
| 101 Property Holdings Llc | -- | None Listed On Document | |
| Our Place Family Dinning Llc | $200,000 | Rkt | |
| Mendez Bell Group Inc | $90,000 | None Available | |
| Smith Pamela R | -- | None Available | |
| Smith Jerry Trustee | -- | -- |
Source: Public Records
Mortgage History
| Date | Status | Borrower | Loan Amount |
|---|---|---|---|
| Previous Owner | Our Place Family Dinning Llc | $200,000 | |
| Previous Owner | Mendez Bell Group Inc | $195,750 |
Source: Public Records
Tax History Compared to Growth
Tax History
| Year | Tax Paid | Tax Assessment Tax Assessment Total Assessment is a certain percentage of the fair market value that is determined by local assessors to be the total taxable value of land and additions on the property. | Land | Improvement |
|---|---|---|---|---|
| 2024 | $3,185 | $51,790 | $7,900 | $43,890 |
| 2023 | $3,185 | $51,790 | $7,900 | $43,890 |
| 2022 | $3,368 | $48,180 | $8,290 | $39,890 |
| 2021 | $3,031 | $48,180 | $8,290 | $39,890 |
| 2020 | $2,736 | $48,180 | $8,290 | $39,890 |
| 2019 | $2,681 | $47,790 | $7,900 | $39,890 |
| 2018 | $1,667 | $27,850 | $7,900 | $19,950 |
| 2017 | $1,689 | $27,850 | $7,900 | $19,950 |
| 2016 | $2,164 | $37,800 | $9,870 | $27,930 |
| 2015 | $1,874 | $37,800 | $9,870 | $27,930 |
| 2014 | $1,063 | $37,800 | $9,870 | $27,930 |
| 2013 | $2,081 | $37,800 | $9,870 | $27,930 |
Source: Public Records
Map
Nearby Homes
- 120 E Ohio St
- 121 S High St
- 233 N Main St
- 362 W Columbus St
- 137 E Espy St
- 324 E North St
- 328 N Detroit St
- 506 E Franklin St
- 513 E Franklin St
- 510 Decatur St
- 530 E Franklin St
- 215 Henry St
- 458 W Columbus St
- 0 Ohio 309
- 416 N Cherry St
- 702 W Franklin St Unit 702 1/2
- 407 Smith Ave
- 223 W Railroad St
- 814 S Wayne St
- 726 Tracy St