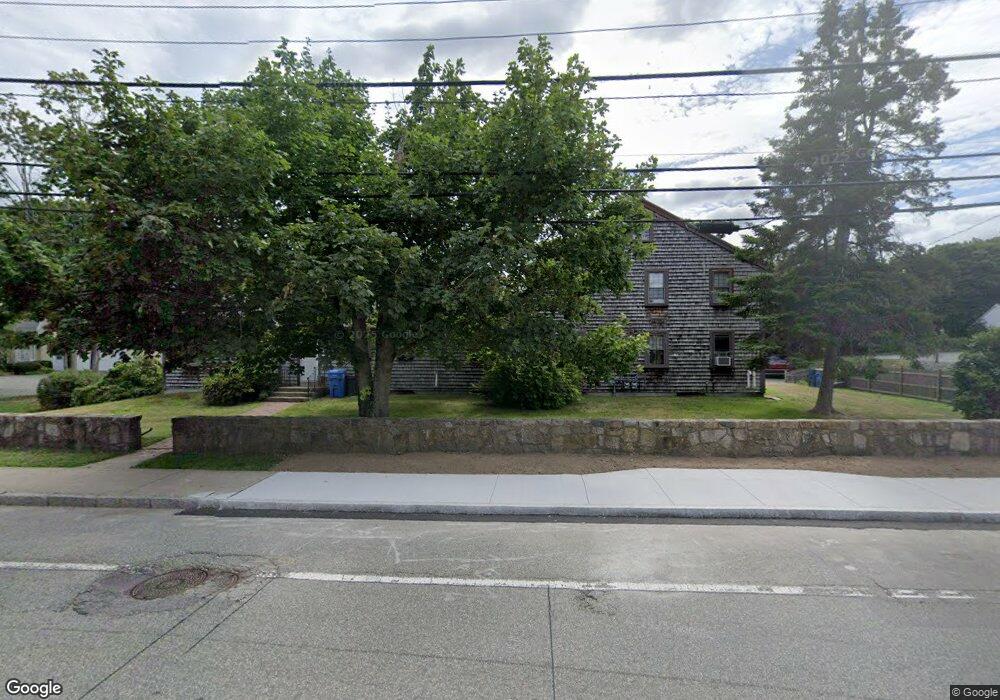
120 S Main St Randolph, MA 02368
Downtown Randolph NeighborhoodEstimated Value: $639,822
4
Beds
3
Baths
2,920
Sq Ft
$219/Sq Ft
Est. Value
About This Home
This home is located at 120 S Main St, Randolph, MA 02368 and is currently estimated at $639,822, approximately $219 per square foot. 120 S Main St is a home located in Norfolk County with nearby schools including Randolph High School and Lighthouse Baptist Christian Academy.
Ownership History
Date
Name
Owned For
Owner Type
Purchase Details
Closed on
Oct 13, 2015
Sold by
Mary E Hurley Ret
Bought by
Curmur Llc
Current Estimated Value
Home Financials for this Owner
Home Financials are based on the most recent Mortgage that was taken out on this home.
Original Mortgage
$335,000
Outstanding Balance
$263,575
Interest Rate
3.88%
Mortgage Type
Commercial
Estimated Equity
$376,247
Purchase Details
Closed on
Aug 28, 2015
Sold by
Previti David J
Bought by
Mary E Hurley Ret
Home Financials for this Owner
Home Financials are based on the most recent Mortgage that was taken out on this home.
Original Mortgage
$335,000
Outstanding Balance
$263,575
Interest Rate
3.88%
Mortgage Type
Commercial
Estimated Equity
$376,247
Purchase Details
Closed on
Jun 27, 2008
Sold by
Hurley Mary E
Bought by
Previti David J
Home Financials for this Owner
Home Financials are based on the most recent Mortgage that was taken out on this home.
Original Mortgage
$400,000
Interest Rate
6.07%
Mortgage Type
Commercial
Create a Home Valuation Report for This Property
The Home Valuation Report is an in-depth analysis detailing your home's value as well as a comparison with similar homes in the area
Home Values in the Area
Average Home Value in this Area
Purchase History
| Date | Buyer | Sale Price | Title Company |
|---|---|---|---|
| Curmur Llc | $335,000 | -- | |
| Mary E Hurley Ret | $365,528 | -- | |
| Previti David J | $400,000 | -- |
Source: Public Records
Mortgage History
| Date | Status | Borrower | Loan Amount |
|---|---|---|---|
| Open | Curmur Llc | $335,000 | |
| Previous Owner | Previti David J | $400,000 |
Source: Public Records
Tax History Compared to Growth
Tax History
| Year | Tax Paid | Tax Assessment Tax Assessment Total Assessment is a certain percentage of the fair market value that is determined by local assessors to be the total taxable value of land and additions on the property. | Land | Improvement |
|---|---|---|---|---|
| 2025 | -- | $696,700 | $233,000 | $463,700 |
| 2024 | -- | $673,500 | $228,400 | $445,100 |
| 2023 | $0 | $634,400 | $207,800 | $426,600 |
| 2022 | $0 | $518,500 | $173,200 | $345,300 |
| 2021 | $0 | $459,500 | $144,300 | $315,200 |
| 2020 | $0 | $456,600 | $144,300 | $312,300 |
| 2019 | $8,135 | $430,300 | $137,400 | $292,900 |
| 2018 | $0 | $408,100 | $124,900 | $283,200 |
| 2017 | $0 | $407,000 | $118,900 | $288,100 |
| 2016 | -- | $371,800 | $108,000 | $263,800 |
| 2015 | -- | $340,100 | $103,000 | $237,100 |
Source: Public Records
Map
Nearby Homes
- 46 Union Square Unit 46
- 40 Linden Park Dr
- 30 Hemlock Terrace
- 7 Brookside Terrace
- 24 Cole Terrace
- 89 Fernandez Cir
- 59 Highland Glen Dr Unit 328
- 6 Dayle Cir
- 20 Selwyn Rd
- 12 Cottage St
- 17 Mill St
- 159 Bittersweet Ln Unit 107
- 28 Silver St
- 4 Lori Ln
- 10 Alfred Terrace
- 314 South St
- 217 Mill St
- 15 Barbara Rd
- 46 Wilmarth Rd
- 229 Mill St