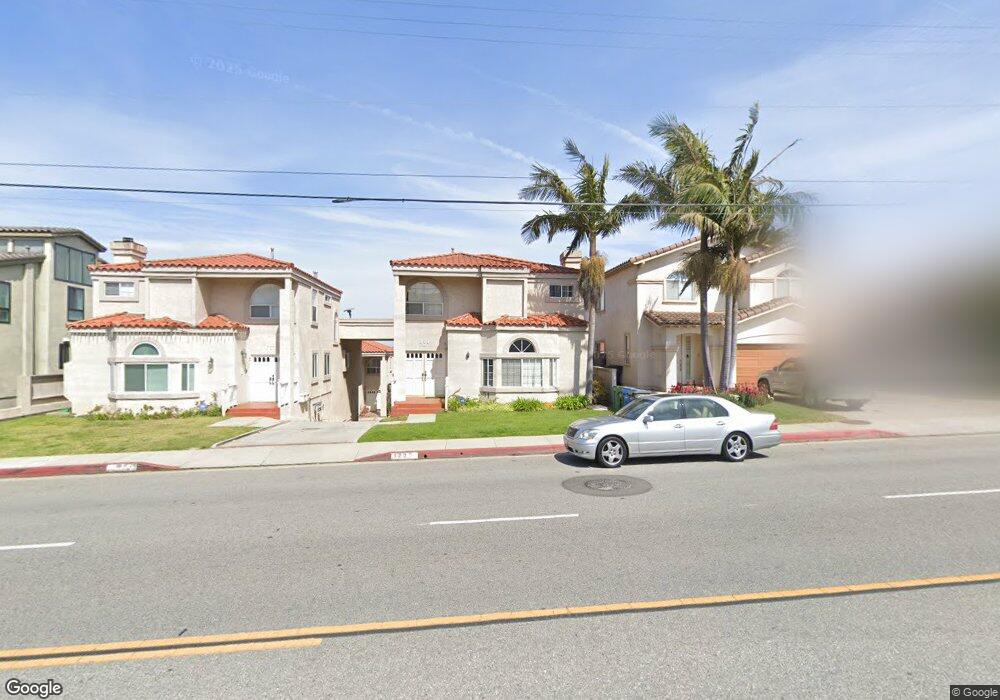
120 S Prospect Ave Unit B Redondo Beach, CA 90277
Estimated Value: $1,153,000 - $1,445,000
4
Beds
3
Baths
1,990
Sq Ft
$647/Sq Ft
Est. Value
About This Home
This home is located at 120 S Prospect Ave Unit B, Redondo Beach, CA 90277 and is currently estimated at $1,287,301, approximately $646 per square foot. 120 S Prospect Ave Unit B is a home located in Los Angeles County with nearby schools including Alta Vista Elementary School, Parras (Nick G.) Middle School, and Redondo Union High School.
Ownership History
Date
Name
Owned For
Owner Type
Purchase Details
Closed on
Oct 24, 2016
Sold by
Malaty Onsi
Bought by
Malaty John Pierre
Current Estimated Value
Home Financials for this Owner
Home Financials are based on the most recent Mortgage that was taken out on this home.
Original Mortgage
$425,000
Interest Rate
3.5%
Mortgage Type
New Conventional
Purchase Details
Closed on
Nov 18, 2006
Sold by
Honnell Darrin A and Honnell Jennifer L
Bought by
Honnell Darrin Allan and Honnell Jennifer Louise
Purchase Details
Closed on
Oct 11, 1993
Sold by
Ting Ming T and Ting Linda L
Bought by
Honnell Darrin A and Honnell Jennifer L
Home Financials for this Owner
Home Financials are based on the most recent Mortgage that was taken out on this home.
Original Mortgage
$242,250
Interest Rate
6.95%
Mortgage Type
Seller Take Back
Create a Home Valuation Report for This Property
The Home Valuation Report is an in-depth analysis detailing your home's value as well as a comparison with similar homes in the area
Home Values in the Area
Average Home Value in this Area
Purchase History
| Date | Buyer | Sale Price | Title Company |
|---|---|---|---|
| Malaty John Pierre | -- | None Available | |
| Malaty Onsi | $720,000 | Fatco | |
| Honnell Darrin Allan | -- | None Available | |
| Honnell Darrin A | $285,000 | Continental Lawyers Title Co |
Source: Public Records
Mortgage History
| Date | Status | Borrower | Loan Amount |
|---|---|---|---|
| Closed | Malaty Onsi | $425,000 | |
| Previous Owner | Honnell Darrin A | $242,250 |
Source: Public Records
Tax History
| Year | Tax Paid | Tax Assessment Tax Assessment Total Assessment is a certain percentage of the fair market value that is determined by local assessors to be the total taxable value of land and additions on the property. | Land | Improvement |
|---|---|---|---|---|
| 2025 | $10,023 | $894,807 | $314,515 | $580,292 |
| 2024 | $10,023 | $877,263 | $308,349 | $568,914 |
| 2023 | $9,841 | $860,062 | $302,303 | $557,759 |
| 2022 | $9,710 | $843,199 | $296,376 | $546,823 |
| 2021 | $9,516 | $826,666 | $290,565 | $536,101 |
| 2019 | $9,332 | $802,148 | $281,948 | $520,200 |
| 2018 | $9,080 | $786,420 | $276,420 | $510,000 |
| 2016 | $4,915 | $409,185 | $209,329 | $199,856 |
| 2015 | $4,827 | $403,039 | $206,185 | $196,854 |
| 2014 | $4,770 | $395,145 | $202,147 | $192,998 |
Source: Public Records
Map
Nearby Homes
- 120 S Prospect Ave Unit A
- 5538 Lorna St
- 222 S Juanita Ave Unit A
- 110 S Irena Ave Unit A
- 110 S Irena Ave Unit B
- 5500 Torrance Blvd Unit B213
- 202 N Irena Ave Unit B
- 1200 Opal St Unit 7
- 235 S Irena Ave Unit B
- 107 S Helberta Ave Unit 4
- 312 N Prospect Ave
- 221 S Guadalupe Ave
- 21110 Wood Ave
- 211 S Francisca Ave Unit B
- 21405 Mildred Ave
- 810 El Redondo Ave
- 318 S Francisca Ave
- 603 S Prospect Ave Unit 205
- 625 Camino Real
- 19946 Linda Dr
- 118 S Prospect Ave Unit B
- 118 S Prospect Ave Unit A
- 118 N Prospect Ave Unit B
- 118 N Prospect Ave
- 122 S Prospect Ave Unit 75
- 114 S Prospect Ave
- 114 S Prospect Ave Unit 6
- 114 S Prospect Ave Unit 5
- 114 S Prospect Ave Unit 4
- 114 S Prospect Ave Unit 3
- 114 S Prospect Ave Unit 2
- 114 S Prospect Ave Unit 1
- 124 S Prospect Ave
- 20739 Tomlee Ave
- 20803 Tomlee Ave
- 126 S Prospect Ave
- 110 S Prospect Ave Unit 6
- 110 S Prospect Ave Unit 5
- 110 S Prospect Ave Unit 4
Your Personal Tour Guide
Ask me questions while you tour the home.