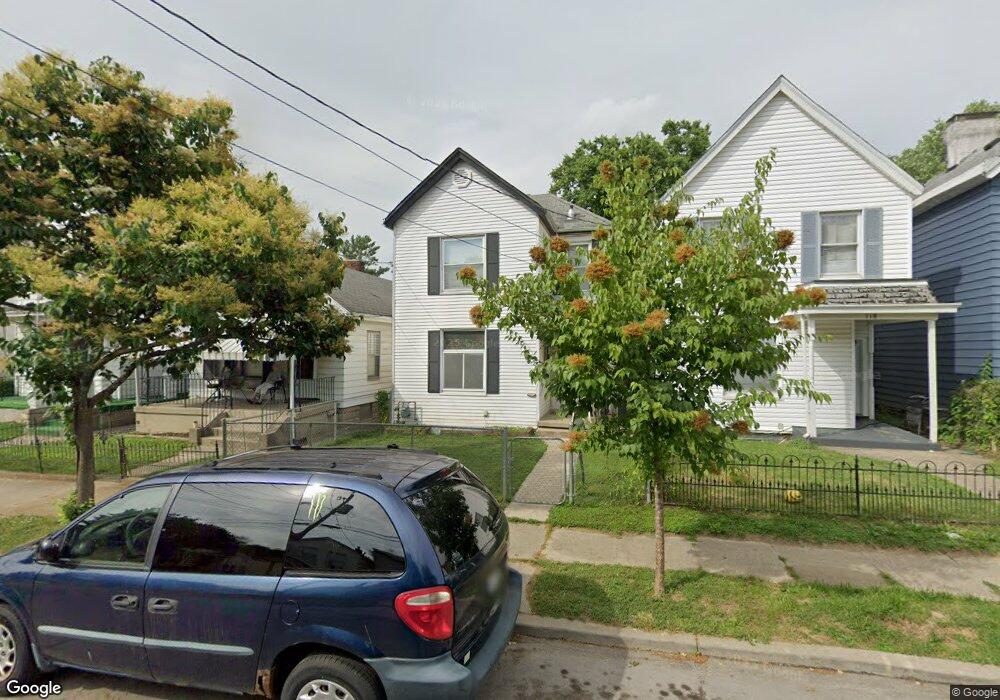
120 W 69th St Cincinnati, OH 45216
Carthage NeighborhoodEstimated Value: $115,018 - $138,000
2
Beds
1
Bath
1,203
Sq Ft
$108/Sq Ft
Est. Value
About This Home
This home is located at 120 W 69th St, Cincinnati, OH 45216 and is currently estimated at $129,505, approximately $107 per square foot. 120 W 69th St is a home located in Hamilton County with nearby schools including Rising Stars at Carthage, Hartwell School, and Shroder High School.
Ownership History
Date
Name
Owned For
Owner Type
Purchase Details
Closed on
Aug 30, 2021
Sold by
Trans Ash Inc
Bought by
Three M C Llc
Current Estimated Value
Purchase Details
Closed on
Aug 31, 2001
Sold by
Wilson Jack L and Wilson Patricia J
Bought by
Heal Robert J
Home Financials for this Owner
Home Financials are based on the most recent Mortgage that was taken out on this home.
Original Mortgage
$59,565
Interest Rate
6.97%
Mortgage Type
FHA
Create a Home Valuation Report for This Property
The Home Valuation Report is an in-depth analysis detailing your home's value as well as a comparison with similar homes in the area
Home Values in the Area
Average Home Value in this Area
Purchase History
| Date | Buyer | Sale Price | Title Company |
|---|---|---|---|
| Three M C Llc | $900,000 | None Listed On Document | |
| Heal Robert J | $60,500 | First Title Agency Inc |
Source: Public Records
Mortgage History
| Date | Status | Borrower | Loan Amount |
|---|---|---|---|
| Previous Owner | Heal Robert J | $59,565 |
Source: Public Records
Tax History Compared to Growth
Tax History
| Year | Tax Paid | Tax Assessment Tax Assessment Total Assessment is a certain percentage of the fair market value that is determined by local assessors to be the total taxable value of land and additions on the property. | Land | Improvement |
|---|---|---|---|---|
| 2024 | $1,195 | $19,723 | $5,859 | $13,864 |
| 2023 | $1,220 | $19,723 | $5,859 | $13,864 |
| 2022 | $872 | $12,573 | $3,140 | $9,433 |
| 2021 | $837 | $12,573 | $3,140 | $9,433 |
| 2020 | $860 | $12,573 | $3,140 | $9,433 |
| 2019 | $812 | $10,837 | $2,706 | $8,131 |
| 2018 | $813 | $10,837 | $2,706 | $8,131 |
| 2017 | $773 | $10,837 | $2,706 | $8,131 |
| 2016 | $905 | $12,565 | $3,605 | $8,960 |
| 2015 | $817 | $12,565 | $3,605 | $8,960 |
| 2014 | $822 | $12,565 | $3,605 | $8,960 |
| 2013 | $836 | $12,565 | $3,605 | $8,960 |
Source: Public Records
Map
Nearby Homes
- 206 W 69th St
- 219 W 70th St
- 120 W Seventy Second St
- 234 W 73rd St
- 137 W Sixty Sixth St
- 6510 Rosewood St
- 125 W 65th St
- 6605 Hasler Ln
- 529 W Sixty Third St
- 117 Nansen St
- 519 Maple St
- 412 Walnut St
- 6106 Sycamore St
- 314 Walnut St
- 6105 Sycamore St
- 38 Escalon St
- 6011 Vine St
- 1139 Towanda Terrace
- 3 Linden St
- 5914 Elmwood Ave