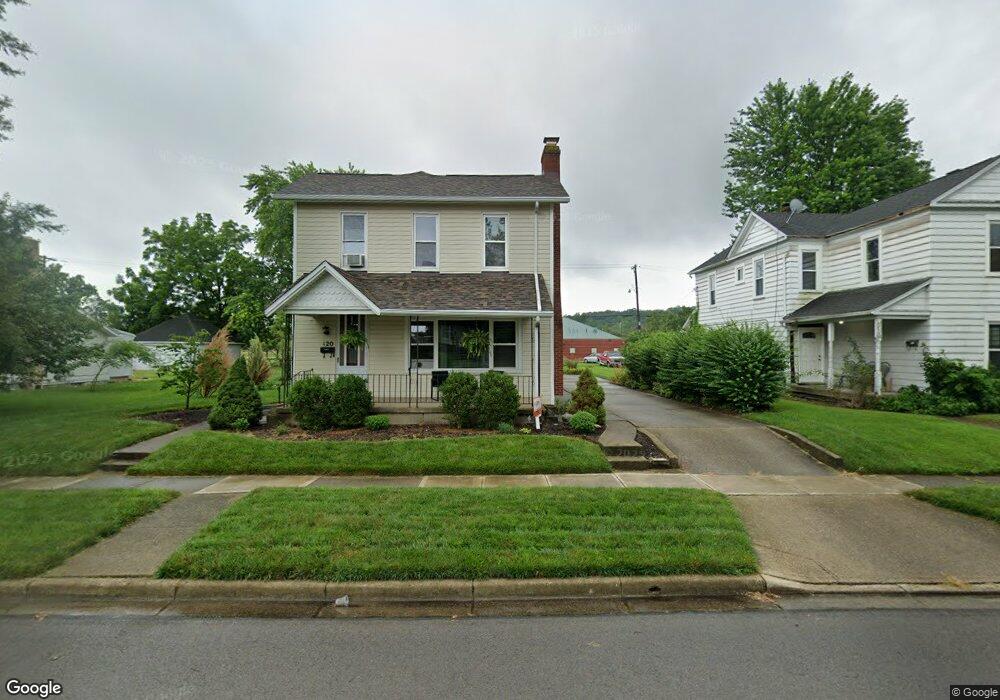
120 W Main St West Carrollton, OH 45449
Estimated Value: $169,000 - $195,000
3
Beds
2
Baths
1,602
Sq Ft
$112/Sq Ft
Est. Value
About This Home
This home is located at 120 W Main St, West Carrollton, OH 45449 and is currently estimated at $179,342, approximately $111 per square foot. 120 W Main St is a home located in Montgomery County with nearby schools including West Carrollton High School, Miami Valley Academies, and Bethel Baptist School.
Ownership History
Date
Name
Owned For
Owner Type
Purchase Details
Closed on
Aug 23, 2004
Sold by
Tibbs Gary L and Vitale Joseph R
Bought by
Watkins Thomas E and Watkins Cheryl L
Current Estimated Value
Home Financials for this Owner
Home Financials are based on the most recent Mortgage that was taken out on this home.
Original Mortgage
$79,600
Outstanding Balance
$39,734
Interest Rate
6.1%
Mortgage Type
Fannie Mae Freddie Mac
Estimated Equity
$139,608
Purchase Details
Closed on
Mar 23, 2004
Sold by
Roddy Mark A and Roddy Melinda C
Bought by
Tibbs Gary L and Vitale Joseph
Home Financials for this Owner
Home Financials are based on the most recent Mortgage that was taken out on this home.
Original Mortgage
$58,500
Interest Rate
5.66%
Mortgage Type
Purchase Money Mortgage
Purchase Details
Closed on
Apr 28, 1995
Sold by
Roddy Constance R
Bought by
Roddy Constance R and Roddy Mark A
Purchase Details
Closed on
Apr 17, 1995
Sold by
Throckmorton Goldie P
Bought by
Roddy Constance R
Create a Home Valuation Report for This Property
The Home Valuation Report is an in-depth analysis detailing your home's value as well as a comparison with similar homes in the area
Home Values in the Area
Average Home Value in this Area
Purchase History
| Date | Buyer | Sale Price | Title Company |
|---|---|---|---|
| Watkins Thomas E | $99,500 | None Available | |
| Tibbs Gary L | $65,000 | Title Pointe Agency | |
| Roddy Constance R | -- | -- | |
| Roddy Constance R | -- | -- |
Source: Public Records
Mortgage History
| Date | Status | Borrower | Loan Amount |
|---|---|---|---|
| Open | Watkins Thomas E | $79,600 | |
| Previous Owner | Tibbs Gary L | $58,500 |
Source: Public Records
Tax History Compared to Growth
Tax History
| Year | Tax Paid | Tax Assessment Tax Assessment Total Assessment is a certain percentage of the fair market value that is determined by local assessors to be the total taxable value of land and additions on the property. | Land | Improvement |
|---|---|---|---|---|
| 2024 | $2,918 | $43,680 | $8,680 | $35,000 |
| 2023 | $2,918 | $43,680 | $8,680 | $35,000 |
| 2022 | $2,682 | $30,780 | $6,110 | $24,670 |
| 2021 | $2,688 | $30,780 | $6,110 | $24,670 |
| 2020 | $2,690 | $30,780 | $6,110 | $24,670 |
| 2019 | $2,261 | $26,020 | $5,560 | $20,460 |
| 2018 | $2,065 | $25,310 | $5,560 | $19,750 |
| 2017 | $2,051 | $25,310 | $5,560 | $19,750 |
| 2016 | $2,042 | $24,580 | $5,560 | $19,020 |
| 2015 | $1,881 | $24,580 | $5,560 | $19,020 |
| 2014 | $1,881 | $24,580 | $5,560 | $19,020 |
| 2012 | -- | $29,070 | $7,000 | $22,070 |
Source: Public Records
Map
Nearby Homes
- 21 W Main St
- 12 E Main St
- 201 S Smith St
- 133 E Circle Dr
- 137 E Central Ave
- 209 E Cottage Ave
- 305 E Central Ave
- 322 E Main St
- 2 Savoy Ave
- 341 E Central Ave
- 109 Cedar St
- 333 E Cottage Ave
- 428 Burns Ave
- 428 E Cottage Ave
- 509 Windsor Ave
- 434 E Cottage Ave
- 758 Cransberry Dr
- 518 Regal Ave
- 706 Cherry Blossom Dr
- 886 Cherry Blossom Dr