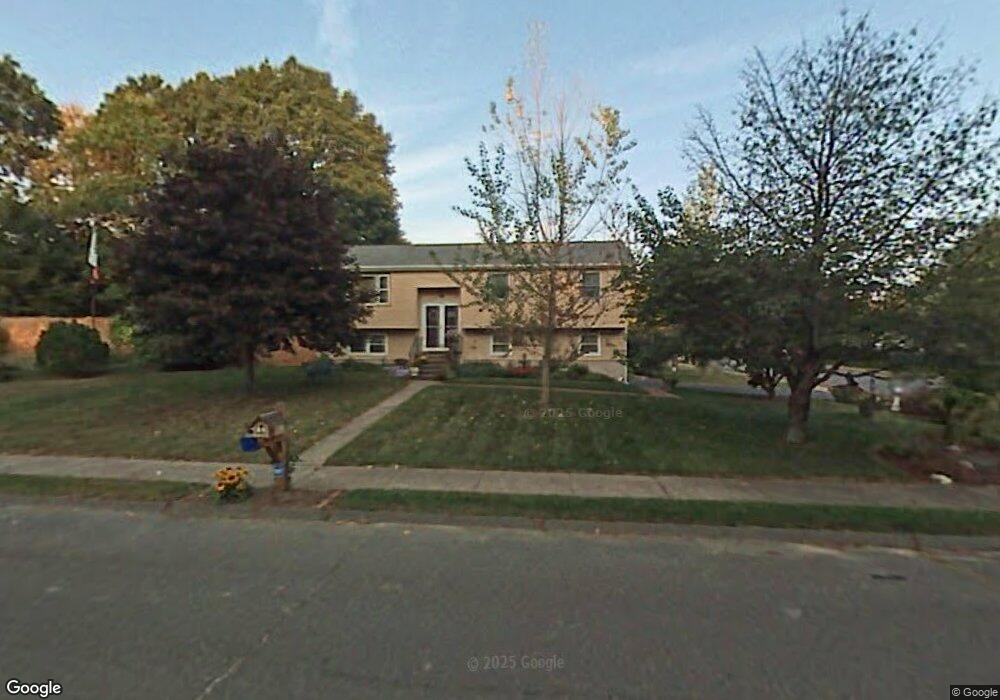
120 Winding Brook Rd Bristol, CT 06010
North Bristol NeighborhoodEstimated Value: $374,000 - $395,000
3
Beds
3
Baths
1,132
Sq Ft
$341/Sq Ft
Est. Value
About This Home
This home is located at 120 Winding Brook Rd, Bristol, CT 06010 and is currently estimated at $386,149, approximately $341 per square foot. 120 Winding Brook Rd is a home located in Hartford County with nearby schools including Edgewood School, Chippens Hill Middle School, and Bristol Eastern High School.
Ownership History
Date
Name
Owned For
Owner Type
Purchase Details
Closed on
Jan 19, 2022
Sold by
Bear Joseph P and Bear Denise
Bought by
Bear Joseph P
Current Estimated Value
Home Financials for this Owner
Home Financials are based on the most recent Mortgage that was taken out on this home.
Original Mortgage
$246,629
Interest Rate
3.45%
Mortgage Type
FHA
Purchase Details
Closed on
Jun 19, 2020
Sold by
Bear Joseph P and Bear Denise
Bought by
Bear Joseph P
Purchase Details
Closed on
Sep 1, 1993
Sold by
Mazotas Leo and Mazotas Kim
Bought by
Hughes Joseph and Hughes Margaret
Purchase Details
Closed on
Jul 10, 1992
Sold by
Furniss Linda M
Bought by
Bear Joseph P and Dougemeck Denise M
Purchase Details
Closed on
Jul 9, 1992
Sold by
Furniss Linda M
Bought by
Bear Joseph and Dougeneck Denise
Create a Home Valuation Report for This Property
The Home Valuation Report is an in-depth analysis detailing your home's value as well as a comparison with similar homes in the area
Home Values in the Area
Average Home Value in this Area
Purchase History
| Date | Buyer | Sale Price | Title Company |
|---|---|---|---|
| Bear Joseph P | -- | None Available | |
| Bear Joseph P | -- | None Available | |
| Bear Joseph P | -- | None Available | |
| Bear Joseph P | -- | None Available | |
| Hughes Joseph | $141,000 | -- | |
| Bear Joseph | $132,000 | -- | |
| Hughes Joseph | $141,000 | -- | |
| Bear Joseph P | $132,000 | -- | |
| Bear Joseph | $132,000 | -- |
Source: Public Records
Mortgage History
| Date | Status | Borrower | Loan Amount |
|---|---|---|---|
| Previous Owner | Bear Joseph P | $246,629 | |
| Previous Owner | Bear Joseph | $269,700 |
Source: Public Records
Tax History Compared to Growth
Tax History
| Year | Tax Paid | Tax Assessment Tax Assessment Total Assessment is a certain percentage of the fair market value that is determined by local assessors to be the total taxable value of land and additions on the property. | Land | Improvement |
|---|---|---|---|---|
| 2025 | $6,745 | $199,850 | $55,160 | $144,690 |
| 2024 | $6,336 | $198,940 | $55,160 | $143,780 |
| 2023 | $6,038 | $198,940 | $55,160 | $143,780 |
| 2022 | $5,573 | $145,320 | $42,560 | $102,760 |
| 2021 | $5,573 | $145,320 | $42,560 | $102,760 |
| 2020 | $5,573 | $145,320 | $42,560 | $102,760 |
| 2019 | $5,529 | $145,320 | $42,560 | $102,760 |
| 2018 | $5,359 | $145,320 | $42,560 | $102,760 |
| 2017 | $5,312 | $147,420 | $60,830 | $86,590 |
| 2016 | $5,453 | $151,340 | $60,830 | $90,510 |
| 2015 | $5,238 | $151,340 | $60,830 | $90,510 |
| 2014 | $5,238 | $151,340 | $60,830 | $90,510 |
Source: Public Records
Map
Nearby Homes
- 104 Winding Brook Rd
- 121 Winding Brook Rd
- 111 Winding Brook Rd
- 36 Hidden Brook Dr
- 101 Winding Brook Rd
- 30 Winding Brook Rd
- 35 Hidden Brook Dr
- 26 Hidden Brook Dr
- 91 Winding Brook Rd
- 94 Winding Brook Rd
- 23 Winding Brook Rd
- 22 Winding Brook Rd
- 25 Hidden Brook Dr
- 18 Winding Brook Rd
- 84 Winding Brook Rd
- 16 Hidden Brook Dr
- 11 Winding Brook Rd
- 26 Winding Brook Rd
- 77 Winding Brook Rd
- 15 Winding Brook Rd