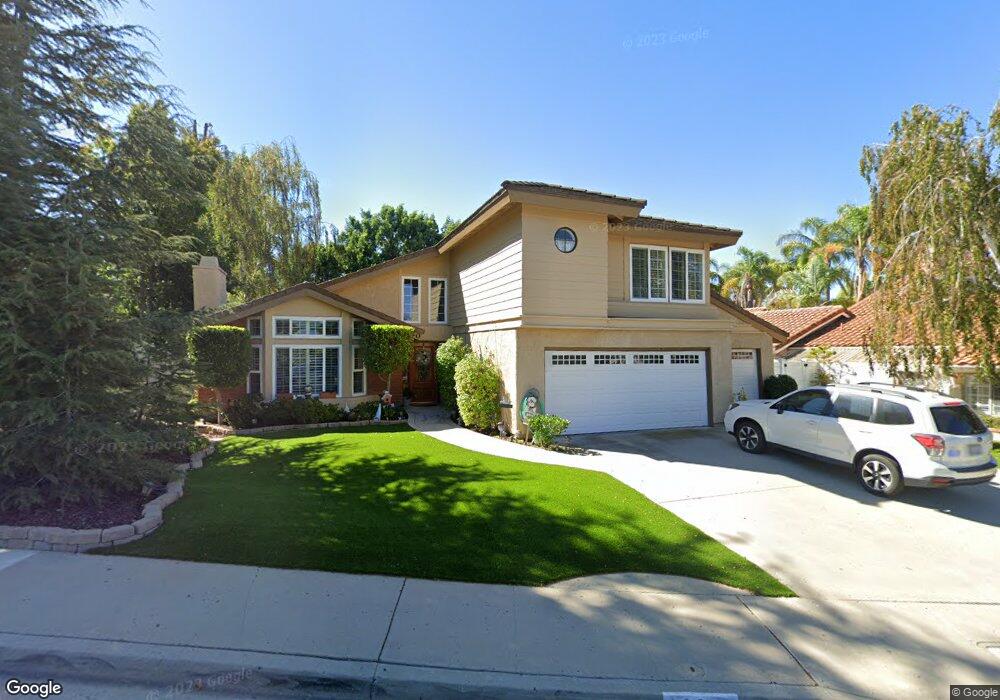
120 Windsong St Thousand Oaks, CA 91360
Estimated Value: $1,136,000 - $1,171,000
4
Beds
4
Baths
2,164
Sq Ft
$534/Sq Ft
Est. Value
About This Home
This home is located at 120 Windsong St, Thousand Oaks, CA 91360 and is currently estimated at $1,155,195, approximately $533 per square foot. 120 Windsong St is a home located in Ventura County with nearby schools including Weathersfield Elementary School, Los Cerritos Middle School, and Thousand Oaks High School.
Ownership History
Date
Name
Owned For
Owner Type
Purchase Details
Closed on
May 28, 2014
Sold by
Stevens Sherry L
Bought by
Stevens Sherry L
Current Estimated Value
Purchase Details
Closed on
Aug 12, 2005
Sold by
Stevens Sherry L and Stevens Patrick T
Bought by
Stevens Patrick T and Stevens Sherry L
Purchase Details
Closed on
Sep 14, 1998
Sold by
Kisman Sherry L and Kisman Sherry L
Bought by
Stevens Sherry L and Stevens Patrick T
Home Financials for this Owner
Home Financials are based on the most recent Mortgage that was taken out on this home.
Original Mortgage
$211,000
Outstanding Balance
$44,643
Interest Rate
6.79%
Estimated Equity
$1,110,552
Purchase Details
Closed on
Jun 3, 1994
Sold by
Kisman Michael L
Bought by
Kisman Sherry L
Create a Home Valuation Report for This Property
The Home Valuation Report is an in-depth analysis detailing your home's value as well as a comparison with similar homes in the area
Home Values in the Area
Average Home Value in this Area
Purchase History
| Date | Buyer | Sale Price | Title Company |
|---|---|---|---|
| Stevens Sherry L | -- | None Available | |
| Stevens Patrick T | -- | -- | |
| Stevens Sherry L | -- | United Title Company | |
| Kisman Sherry L | -- | -- |
Source: Public Records
Mortgage History
| Date | Status | Borrower | Loan Amount |
|---|---|---|---|
| Open | Stevens Sherry L | $211,000 |
Source: Public Records
Tax History Compared to Growth
Tax History
| Year | Tax Paid | Tax Assessment Tax Assessment Total Assessment is a certain percentage of the fair market value that is determined by local assessors to be the total taxable value of land and additions on the property. | Land | Improvement |
|---|---|---|---|---|
| 2025 | $3,403 | $427,429 | $81,399 | $346,030 |
| 2024 | $3,403 | $419,049 | $79,803 | $339,246 |
| 2023 | $3,343 | $410,833 | $78,238 | $332,595 |
| 2022 | $3,355 | $402,778 | $76,704 | $326,074 |
| 2021 | $3,278 | $394,881 | $75,200 | $319,681 |
| 2020 | $2,907 | $390,834 | $74,430 | $316,404 |
| 2019 | $2,841 | $383,171 | $72,971 | $310,200 |
| 2018 | $2,797 | $375,659 | $71,541 | $304,118 |
| 2017 | $2,753 | $368,294 | $70,139 | $298,155 |
| 2016 | $2,732 | $361,073 | $68,764 | $292,309 |
| 2015 | $2,680 | $355,651 | $67,732 | $287,919 |
| 2014 | $2,617 | $348,686 | $66,406 | $282,280 |
Source: Public Records
Map
Nearby Homes
- 205 Larkhill St
- 71 Del Ray Cir
- 3342 Heatherglow St
- 73 Mcafee Ct
- 87 Mcafee Ct
- 416 Camino Dos Palos
- 221 Mcafee Ct
- 2947 Camino Del Zuro
- 212 Cedar Heights Dr
- 2651 Sirius St
- 3275 Camino Calandria
- 2660 Calle Abedul
- 3931 Bucklin Place
- 731 Calle Nogal
- 226 Tennyson St
- 2340 Aldrich Cir
- 650 Calle Pensamiento
- 3037 Fort Courage Ave
- 136 Erten St
- 2590 Scott Place
- 114 Windsong St
- 128 Windsong St
- 117 Springdale Ct
- 111 Springdale Ct
- 3215 Thistlewood St
- 115 Windsong St
- 121 Windsong St
- 134 Windsong St
- 123 Windsong St
- 105 Springdale Ct
- 3131 Cherrywood Dr
- 3197 Thistlewood St
- 140 Windsong St
- 107 Windsong St
- 108 Windsong St
- 3225 Spring Meadow Ave
- 99 Springdale Ct
- 112 Springdale Ct
- 3134 Cherrywood Dr
- 118 Springdale Ct