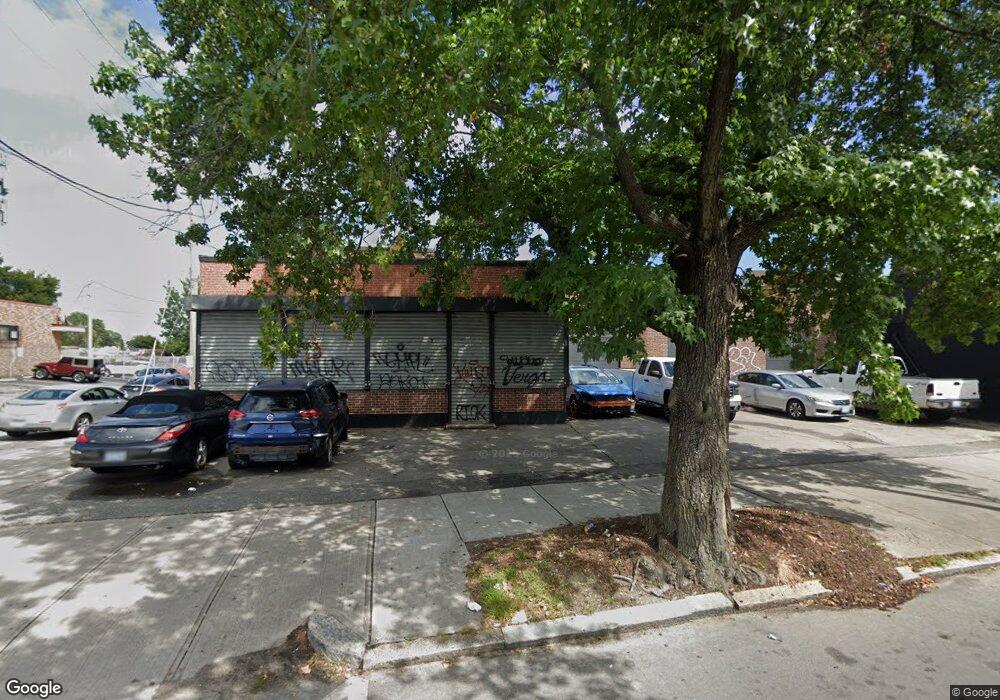
1200 Broad St Providence, RI 02905
Washington Park NeighborhoodEstimated Value: $654,896
--
Bed
--
Bath
5,312
Sq Ft
$123/Sq Ft
Est. Value
About This Home
This home is located at 1200 Broad St, Providence, RI 02905 and is currently estimated at $654,896, approximately $123 per square foot. 1200 Broad St is a home located in Providence County with nearby schools including Asa Messer Elementary School, Charles N. Fortes Elementary School, and Alan Shawn Feinstein Elementary.
Ownership History
Date
Name
Owned For
Owner Type
Purchase Details
Closed on
Aug 29, 2024
Sold by
Roskap Assoc
Bought by
Yahweh Property Mgmt Corp
Current Estimated Value
Home Financials for this Owner
Home Financials are based on the most recent Mortgage that was taken out on this home.
Original Mortgage
$318,400
Outstanding Balance
$314,727
Interest Rate
6.77%
Mortgage Type
Purchase Money Mortgage
Estimated Equity
$340,169
Create a Home Valuation Report for This Property
The Home Valuation Report is an in-depth analysis detailing your home's value as well as a comparison with similar homes in the area
Home Values in the Area
Average Home Value in this Area
Purchase History
| Date | Buyer | Sale Price | Title Company |
|---|---|---|---|
| Yahweh Property Mgmt Corp | $620,000 | None Available | |
| Yahweh Property Mgmt Corp | $620,000 | None Available |
Source: Public Records
Mortgage History
| Date | Status | Borrower | Loan Amount |
|---|---|---|---|
| Open | Yahweh Property Mgmt Corp | $318,400 | |
| Closed | Yahweh Property Mgmt Corp | $318,400 |
Source: Public Records
Tax History Compared to Growth
Tax History
| Year | Tax Paid | Tax Assessment Tax Assessment Total Assessment is a certain percentage of the fair market value that is determined by local assessors to be the total taxable value of land and additions on the property. | Land | Improvement |
|---|---|---|---|---|
| 2025 | $16,346 | $559,800 | $202,100 | $357,700 |
| 2024 | $9,961 | $283,800 | $112,300 | $171,500 |
| 2023 | $9,961 | $283,800 | $112,300 | $171,500 |
| 2022 | $10,047 | $283,800 | $112,300 | $171,500 |
| 2021 | $7,982 | $217,500 | $91,200 | $126,300 |
| 2020 | $7,982 | $217,500 | $91,200 | $126,300 |
| 2019 | $7,982 | $217,500 | $91,200 | $126,300 |
| 2018 | $7,593 | $206,900 | $91,200 | $115,700 |
| 2017 | $7,593 | $206,900 | $91,200 | $115,700 |
| 2016 | $7,593 | $206,900 | $91,200 | $115,700 |
| 2015 | $7,100 | $193,200 | $86,900 | $106,300 |
| 2014 | $7,100 | $193,200 | $86,900 | $106,300 |
| 2013 | $7,100 | $193,200 | $86,900 | $106,300 |
Source: Public Records
Map
Nearby Homes