1200 E 130th Ave Thornton, CO 80241
Hunters Glen NeighborhoodEstimated Value: $445,000 - $492,000
2
Beds
3
Baths
2,234
Sq Ft
$209/Sq Ft
Est. Value
About This Home
This home is located at 1200 E 130th Ave, Thornton, CO 80241 and is currently estimated at $467,713, approximately $209 per square foot. 1200 E 130th Ave is a home located in Adams County with nearby schools including Hunters Glen Elementary School, Century Middle School, and Mountain Range High School.
Ownership History
Date
Name
Owned For
Owner Type
Purchase Details
Closed on
Dec 11, 2015
Sold by
Spicer Frank H
Bought by
Beaber Kathryn Harding
Current Estimated Value
Home Financials for this Owner
Home Financials are based on the most recent Mortgage that was taken out on this home.
Original Mortgage
$270,750
Outstanding Balance
$211,851
Interest Rate
3.88%
Mortgage Type
New Conventional
Estimated Equity
$255,862
Purchase Details
Closed on
Sep 28, 1995
Sold by
Hunters Glen Lakeshore Llc
Bought by
Spicer Frank H and Spicer Janet E
Home Financials for this Owner
Home Financials are based on the most recent Mortgage that was taken out on this home.
Original Mortgage
$150,000
Interest Rate
7.62%
Purchase Details
Closed on
Feb 4, 1993
Purchase Details
Closed on
Dec 4, 1991
Create a Home Valuation Report for This Property
The Home Valuation Report is an in-depth analysis detailing your home's value as well as a comparison with similar homes in the area
Home Values in the Area
Average Home Value in this Area
Purchase History
| Date | Buyer | Sale Price | Title Company |
|---|---|---|---|
| Beaber Kathryn Harding | $285,000 | Fidelity National Title | |
| Spicer Frank H | $159,189 | -- | |
| -- | -- | -- | |
| -- | -- | -- |
Source: Public Records
Mortgage History
| Date | Status | Borrower | Loan Amount |
|---|---|---|---|
| Open | Beaber Kathryn Harding | $270,750 | |
| Previous Owner | Spicer Frank H | $150,000 |
Source: Public Records
Tax History
| Year | Tax Paid | Tax Assessment Tax Assessment Total Assessment is a certain percentage of the fair market value that is determined by local assessors to be the total taxable value of land and additions on the property. | Land | Improvement |
|---|---|---|---|---|
| 2025 | $3,502 | $33,870 | $8,950 | $24,920 |
| 2024 | $3,502 | $31,130 | $8,230 | $22,900 |
| 2023 | $3,466 | $37,540 | $7,100 | $30,440 |
| 2022 | $2,953 | $26,810 | $7,300 | $19,510 |
| 2021 | $3,052 | $26,810 | $7,300 | $19,510 |
| 2020 | $2,894 | $25,940 | $7,510 | $18,430 |
| 2019 | $2,900 | $25,940 | $7,510 | $18,430 |
| 2018 | $2,335 | $20,290 | $2,920 | $17,370 |
| 2017 | $2,123 | $20,290 | $2,920 | $17,370 |
| 2016 | $2,153 | $20,030 | $3,230 | $16,800 |
| 2015 | $1,295 | $12,080 | $1,950 | $10,130 |
| 2014 | -- | $7,500 | $1,620 | $5,880 |
Source: Public Records
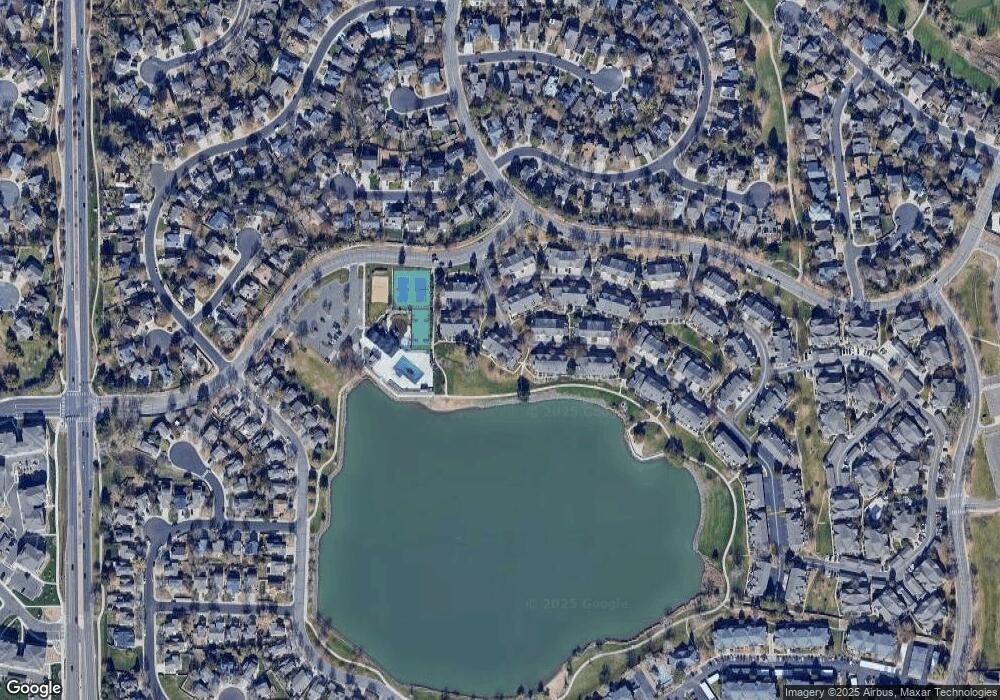
Map
Nearby Homes
- 1174 E 130th Dr
- 12905 Lafayette St Unit H
- 1672 E 131st Ct
- 13262 Pearl Cir
- 7 Sandpiper Cir
- 12885 Vine St
- 12962 Grant Cir E Unit A
- 12913 Grant Cir E Unit A
- 12963 Grant Cir E Unit A
- 12944 Grant Cir W Unit B
- 2066 E 129th Ave
- 491 E 133rd Way
- 12931 Grant Cir W Unit C
- 13023 Grant Cir E Unit C
- 13000 Grant Cir W Unit B
- 13550 Washington St Unit 7C
- 13151 Grant Cir N Unit C
- 2275 E 129th Ave
- 2297 E 128th Ave
- 58 Blue Heron Dr
- 1200 E 130th Ave Unit D
- 1200 E 130th Ave Unit C
- 1200 E 130th Ave Unit B
- 1200 E 130th Ave Unit A
- 1090 E 130th Ave Unit D
- 1090 E 130th Ave Unit C
- 1090 E 130th Ave Unit B
- 1090 E 130th Ave Unit A
- 1214 E 130th Ave Unit D
- 1214 E 130th Ave Unit C
- 1214 E 130th Ave Unit B
- 1214 E 130th Ave Unit A
- 1210 E 130th Ave Unit A
- 1210 E 130th Ave Unit B
- 1210 E 130th Ave Unit C
- 1210 E 130th Ave Unit D
- 1210 E 130th Ave Unit C
- 1100 E 130th Ave Unit D
- 1100 E 130th Ave Unit B
- 1100 E 130th Ave Unit A
Your Personal Tour Guide
Ask me questions while you tour the home.