
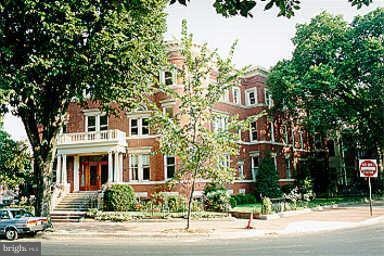

1200 E Capitol St NE Unit 3 Washington, DC 20002
Capitol Hill Neighborhood
1
Bed
1.5
Baths
1,411
Sq Ft
$492/mo
HOA Fee
Highlights
- Traditional Floor Plan
- Traditional Architecture
- Main Floor Bedroom
- Maury Elementary School Rated A-
- Wood Flooring
- 1-minute walk to Lincoln Park
About This Home
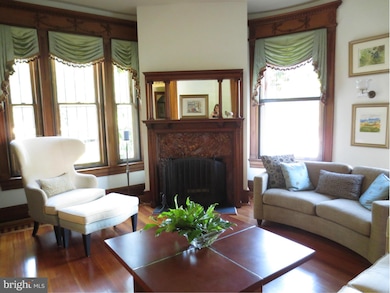
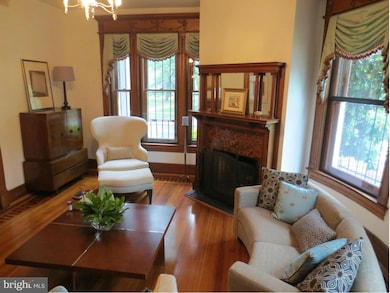
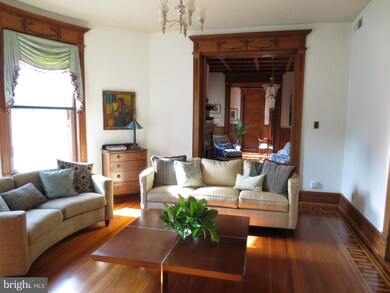
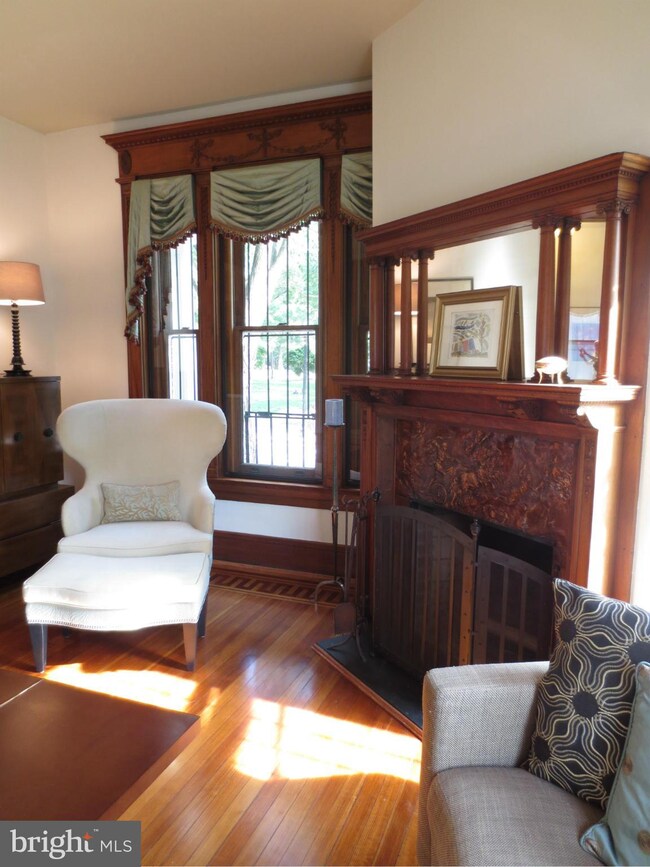
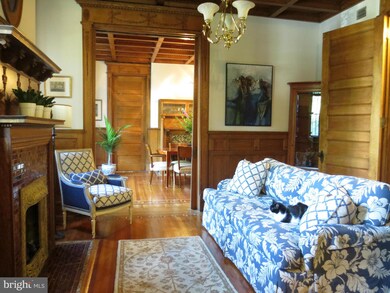
As of August 2023Exquisite condo/mansion with panoramic park views! Over 1400 sq.ft. of grand entertaining space. Feast your eyes on the inlaid floors, coffered ceilings, wainscoting, 3 fireplaces, stunning new kitchen, spa-like bath, and ample storage! 1st floor unit, all on one level. On Lincoln Park and close to Eastern Market. This one will take your breath away!
Property Details
Home Type
- Condominium
Est. Annual Taxes
- $4,262
Year Built
- Built in 1880
Lot Details
- Property is in very good condition
HOA Fees
- $492 Monthly HOA Fees
Parking
- On-Street Parking
Home Design
- Traditional Architecture
- Brick Exterior Construction
- Plaster Walls
Interior Spaces
- 1,411 Sq Ft Home
- Property has 1 Level
- Traditional Floor Plan
- Wainscoting
- Ceiling height of 9 feet or more
- Recessed Lighting
- 3 Fireplaces
- Fireplace Mantel
- Window Treatments
- Family Room
- Living Room
- Dining Area
- Wood Flooring
Kitchen
- Double Self-Cleaning Oven
- Stove
- Microwave
- Ice Maker
- Dishwasher
- Upgraded Countertops
- Disposal
Bedrooms and Bathrooms
- 1 Main Level Bedroom
Laundry
- Front Loading Dryer
- Front Loading Washer
Home Security
Utilities
- Forced Air Heating and Cooling System
- Vented Exhaust Fan
- Electric Water Heater
Listing and Financial Details
- Tax Lot 2024
- Assessor Parcel Number 1011//2024
Community Details
Overview
- Moving Fees Required
- Association fees include water, trash, reserve funds, snow removal, insurance, management, lawn maintenance, lawn care side, lawn care front, exterior building maintenance
- Low-Rise Condominium
- Old City #1 Community
- Old City #1 Subdivision
Additional Features
- Common Area
- Storm Windows
Ownership History
Date
Name
Owned For
Owner Type
Purchase Details
Listed on
Jan 13, 2023
Closed on
Aug 24, 2023
Sold by
Marilynn Gurian Living Trust
Bought by
Alberti Nicholas and Nelson Elizabeth
Seller's Agent
John Smith
Berkshire Hathaway HomeServices PenFed Realty
Buyer's Agent
Suzette Sydney
Berkshire Hathaway HomeServices PenFed Realty
List Price
$1,987,000
Sold Price
$855,000
Premium/Discount to List
-$1,132,000
-56.97%
Views
56
Current Estimated Value
Home Financials for this Owner
Home Financials are based on the most recent Mortgage that was taken out on this home.
Estimated Appreciation
-$113,070
Avg. Annual Appreciation
-7.42%
Purchase Details
Closed on
Nov 6, 2014
Sold by
Gurian Marilynn
Bought by
Gurian Trustee Marilynn and The Marilynn Gurian Living Tru
Purchase Details
Listed on
Jun 5, 2014
Closed on
Jul 17, 2014
Sold by
Parker Martin
Bought by
Gurian Marilynn
Seller's Agent
Jackie Sink
Compass
Buyer's Agent
Michael Sullivan
Long & Foster Real Estate, Inc.
List Price
$669,000
Sold Price
$655,000
Premium/Discount to List
-$14,000
-2.09%
Home Financials for this Owner
Home Financials are based on the most recent Mortgage that was taken out on this home.
Avg. Annual Appreciation
1.15%
Original Mortgage
$417,000
Interest Rate
4.18%
Mortgage Type
New Conventional
Purchase Details
Closed on
Aug 30, 2011
Sold by
Pack Thomas J
Bought by
Parker Martin
Home Financials for this Owner
Home Financials are based on the most recent Mortgage that was taken out on this home.
Original Mortgage
$417,000
Interest Rate
4.52%
Mortgage Type
New Conventional
Purchase Details
Closed on
Oct 30, 1998
Sold by
Berry Marrell J
Bought by
Pack Thomas J
Home Financials for this Owner
Home Financials are based on the most recent Mortgage that was taken out on this home.
Original Mortgage
$151,200
Interest Rate
6.49%
Similar Homes in Washington, DC
Create a Home Valuation Report for This Property
The Home Valuation Report is an in-depth analysis detailing your home's value as well as a comparison with similar homes in the area
Home Values in the Area
Average Home Value in this Area
Purchase History
| Date | Type | Sale Price | Title Company |
|---|---|---|---|
| Deed | $855,000 | Westcor Land Title Insurance C | |
| Deed | -- | -- | |
| Deed | -- | -- | |
| Warranty Deed | $470,000 | -- | |
| Deed | $189,545 | -- |
Source: Public Records
Mortgage History
| Date | Status | Loan Amount | Loan Type |
|---|---|---|---|
| Previous Owner | $417,000 | New Conventional | |
| Previous Owner | $200,000 | Credit Line Revolving | |
| Previous Owner | $417,000 | New Conventional | |
| Previous Owner | $50,000 | Credit Line Revolving | |
| Previous Owner | $151,200 | No Value Available |
Source: Public Records
Property History
| Date | Event | Price | Change | Sq Ft Price |
|---|---|---|---|---|
| 08/18/2023 08/18/23 | Sold | $855,000 | -8.8% | $606 / Sq Ft |
| 07/21/2023 07/21/23 | Price Changed | $937,000 | -1.4% | $664 / Sq Ft |
| 07/20/2023 07/20/23 | Price Changed | $950,000 | +8.6% | $673 / Sq Ft |
| 07/18/2023 07/18/23 | Price Changed | $875,000 | -56.0% | $620 / Sq Ft |
| 07/18/2023 07/18/23 | For Sale | $1,987,000 | +132.4% | $1,408 / Sq Ft |
| 07/18/2023 07/18/23 | Off Market | $855,000 | -- | -- |
| 07/15/2023 07/15/23 | Price Changed | $937,000 | -5.1% | $664 / Sq Ft |
| 04/07/2023 04/07/23 | For Sale | $987,000 | +15.4% | $700 / Sq Ft |
| 04/02/2023 04/02/23 | Off Market | $855,000 | -- | -- |
| 03/31/2023 03/31/23 | For Sale | $987,000 | +15.4% | $700 / Sq Ft |
| 03/19/2023 03/19/23 | Off Market | $855,000 | -- | -- |
| 03/10/2023 03/10/23 | For Sale | $987,000 | +15.4% | $700 / Sq Ft |
| 03/05/2023 03/05/23 | Off Market | $855,000 | -- | -- |
| 03/03/2023 03/03/23 | For Sale | $987,000 | +15.4% | $700 / Sq Ft |
| 02/14/2023 02/14/23 | Off Market | $855,000 | -- | -- |
| 02/10/2023 02/10/23 | For Sale | $987,000 | +15.4% | $700 / Sq Ft |
| 02/05/2023 02/05/23 | Off Market | $855,000 | -- | -- |
| 02/03/2023 02/03/23 | For Sale | $987,000 | +15.4% | $700 / Sq Ft |
| 01/30/2023 01/30/23 | Off Market | $855,000 | -- | -- |
| 01/27/2023 01/27/23 | For Sale | $987,000 | +15.4% | $700 / Sq Ft |
| 01/16/2023 01/16/23 | Off Market | $855,000 | -- | -- |
| 01/13/2023 01/13/23 | For Sale | $987,000 | +50.7% | $700 / Sq Ft |
| 07/17/2014 07/17/14 | Sold | $655,000 | -2.1% | $464 / Sq Ft |
| 06/19/2014 06/19/14 | Pending | -- | -- | -- |
| 06/05/2014 06/05/14 | For Sale | $669,000 | -- | $474 / Sq Ft |
Source: Bright MLS
Tax History Compared to Growth
Tax History
| Year | Tax Paid | Tax Assessment Tax Assessment Total Assessment is a certain percentage of the fair market value that is determined by local assessors to be the total taxable value of land and additions on the property. | Land | Improvement |
|---|---|---|---|---|
| 2024 | $6,199 | $744,430 | $223,330 | $521,100 |
| 2023 | $5,954 | $715,150 | $214,540 | $500,610 |
| 2022 | $5,656 | $679,200 | $203,760 | $475,440 |
| 2021 | $5,706 | $684,560 | $205,370 | $479,190 |
| 2020 | $5,957 | $700,840 | $210,250 | $490,590 |
| 2019 | $5,569 | $655,170 | $196,550 | $458,620 |
| 2018 | $5,579 | $656,310 | $0 | $0 |
| 2017 | $5,124 | $602,860 | $0 | $0 |
| 2016 | $5,161 | $607,190 | $0 | $0 |
| 2015 | $4,700 | $552,890 | $0 | $0 |
| 2014 | $4,120 | $519,770 | $0 | $0 |
Source: Public Records
Agents Affiliated with this Home
-
John Smith
Seller's Agent in 2023
John Smith
BHHS PenFed (actual)
(202) 262-6037
17 in this area
55 Total Sales
-
Aaron Smith
Seller Co-Listing Agent in 2023
Aaron Smith
BHHS PenFed (actual)
(202) 608-1887
17 in this area
42 Total Sales
-
Suzette Sydney
Buyer's Agent in 2023
Suzette Sydney
BHHS PenFed (actual)
(202) 412-1262
1 in this area
10 Total Sales
-
Jackie Sink
Seller's Agent in 2014
Jackie Sink
Compass
(202) 352-5793
24 in this area
67 Total Sales
-
Libby Clarke
Seller Co-Listing Agent in 2014
Libby Clarke
Compass
(202) 841-1812
36 in this area
89 Total Sales
-
Michael Sullivan
M
Buyer's Agent in 2014
Michael Sullivan
Long & Foster
(202) 686-7707
1 Total Sale
Map
Source: Bright MLS
MLS Number: 1003037884
APN: 1011-2024
Disclaimer: Certain information contained herein is derived from information provided by parties other than Homes.com. All information provided is deemed reliable, but is not guaranteed to be accurate and should be independently verified.
![]() The data relating to real estate for sale on this website appears in part through the BRIGHT Internet Data Exchange program, a voluntary cooperative exchange of property listing data between licensed real estate brokerage firms, and is provided by BRIGHT through a licensing agreement.
The data relating to real estate for sale on this website appears in part through the BRIGHT Internet Data Exchange program, a voluntary cooperative exchange of property listing data between licensed real estate brokerage firms, and is provided by BRIGHT through a licensing agreement.
Listing information is from various brokers who participate in the Bright MLS IDX program and not all listings may be visible on the site.
The property information being provided on or through the website is for the personal, non-commercial use of consumers and such information may not be used for any purpose other than to identify prospective properties consumers may be interested in purchasing.
Some properties which appear for sale on the website may no longer be available because they are for instance, under contract, sold or are no longer being offered for sale.
Property information displayed is deemed reliable but is not guaranteed.
Copyright 2025 Bright MLS, Inc.
Nearby Homes
- 131 11th St NE Unit 3
- 135 13th St NE
- 218 12th Place NE
- 209 11th St NE
- 130 Kentucky Ave SE
- 14 10th St NE
- 1112 Park St NE
- 123 13th St SE
- 1224 Independence Ave SE
- 1206 C St NE
- 18 9th St NE Unit 207
- 130 10th St SE
- 304 12th St NE
- 1387 N Carolina Ave NE
- 244 10th St NE
- 252 10th St NE
- 91 14th St NE Unit 91
- 1002 C St NE
- 1201 D St NE
- 333 12th St NE