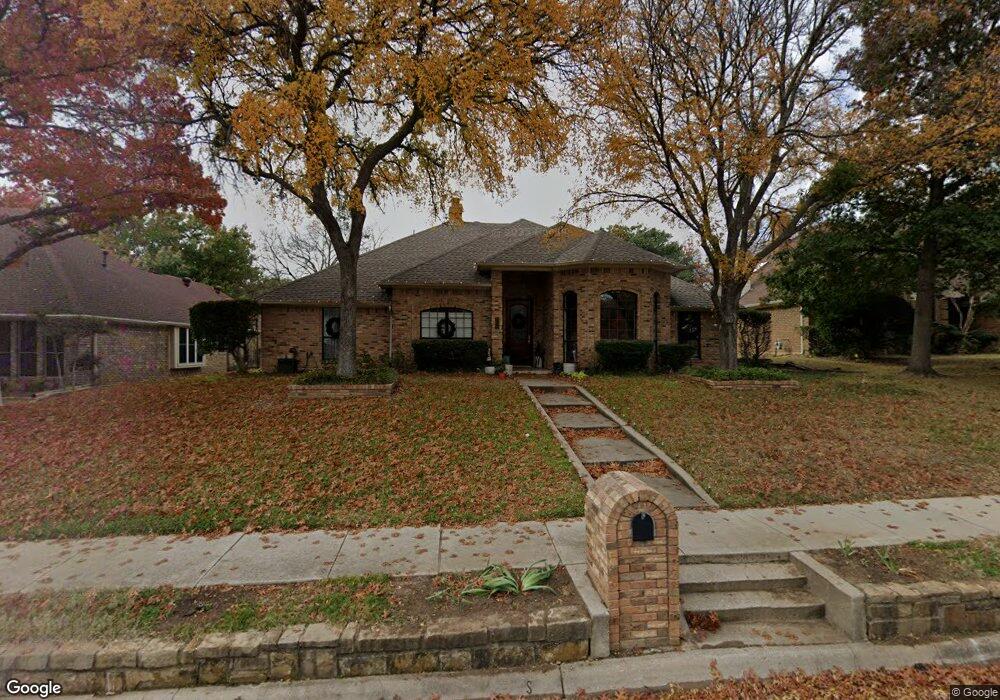
1200 Pennsylvania Dr Denton, TX 76205
South Denton NeighborhoodEstimated Value: $399,466 - $444,000
3
Beds
3
Baths
2,473
Sq Ft
$172/Sq Ft
Est. Value
About This Home
This home is located at 1200 Pennsylvania Dr, Denton, TX 76205 and is currently estimated at $424,367, approximately $171 per square foot. 1200 Pennsylvania Dr is a home located in Denton County with nearby schools including Houston Elementary School, McMath Middle School, and Denton High School.
Ownership History
Date
Name
Owned For
Owner Type
Purchase Details
Closed on
Jun 8, 2017
Sold by
Moore Kyle J Moore and Moore Alyssa L Moore
Bought by
Great Western Financial Service Inc
Current Estimated Value
Home Financials for this Owner
Home Financials are based on the most recent Mortgage that was taken out on this home.
Original Mortgage
$202,500
Outstanding Balance
$168,576
Interest Rate
4.05%
Mortgage Type
New Conventional
Estimated Equity
$255,791
Purchase Details
Closed on
Apr 11, 2017
Sold by
Wells Fargo Bank Na
Bought by
Wells Fargo Bank Na and Estate Of Letha K Majors
Home Financials for this Owner
Home Financials are based on the most recent Mortgage that was taken out on this home.
Original Mortgage
$202,500
Outstanding Balance
$168,576
Interest Rate
4.05%
Mortgage Type
New Conventional
Estimated Equity
$255,791
Purchase Details
Closed on
Oct 4, 2013
Sold by
Majors Letha K
Bought by
Wells Fargo Bank Na
Create a Home Valuation Report for This Property
The Home Valuation Report is an in-depth analysis detailing your home's value as well as a comparison with similar homes in the area
Home Values in the Area
Average Home Value in this Area
Purchase History
| Date | Buyer | Sale Price | Title Company |
|---|---|---|---|
| Great Western Financial Service Inc | $202,500 | None Available | |
| Wells Fargo Bank Na | -- | None Available | |
| Wells Fargo Bank Na | -- | None Available |
Source: Public Records
Mortgage History
| Date | Status | Borrower | Loan Amount |
|---|---|---|---|
| Open | Great Western Financial Service Inc | $202,500 |
Source: Public Records
Tax History Compared to Growth
Tax History
| Year | Tax Paid | Tax Assessment Tax Assessment Total Assessment is a certain percentage of the fair market value that is determined by local assessors to be the total taxable value of land and additions on the property. | Land | Improvement |
|---|---|---|---|---|
| 2025 | $5,541 | $330,937 | $89,658 | $241,279 |
| 2024 | $6,736 | $349,000 | $89,658 | $259,342 |
| 2023 | $5,070 | $328,198 | $89,501 | $259,499 |
| 2022 | $6,334 | $298,362 | $79,110 | $252,415 |
| 2021 | $6,030 | $271,238 | $52,740 | $218,498 |
| 2020 | $5,779 | $252,820 | $52,740 | $200,080 |
| 2019 | $5,653 | $236,916 | $52,740 | $184,176 |
| 2018 | $5,435 | $225,000 | $52,740 | $172,260 |
| 2017 | $6,325 | $255,875 | $52,740 | $203,135 |
| 2016 | $6,181 | $224,054 | $52,740 | $179,103 |
| 2015 | $2,236 | $203,685 | $52,740 | $165,395 |
| 2013 | -- | $169,996 | $30,589 | $139,407 |
Source: Public Records
Map
Nearby Homes
- 1012 Indian Ridge Dr
- 816 Chapel Dr
- 1108 Ellison Park Cir
- 824 Sandpiper Dr
- 916 Smokerise Cir
- 720 Smokerise Cir
- 821 Sandpiper Dr
- 1000 Lynhurst Ln
- 829 Skylark Dr
- 2226 Savannah Trail
- 2216 Jefferson Trail
- 2000 Lamprey Cir
- 2009 Lake Fork Ct
- 924 Ridgecrest Cir
- 2253 Hollyhill Ln
- 2272 Hollyhill Ln
- 2012 Hollyhill Ln
- 2209 Loon Lake Rd
- 2120 Fairfax Rd
- 2218 Southridge Dr
- 1204 Pennsylvania Dr
- 1112 Pennsylvania Dr
- 1113 Hope St
- 1208 Pennsylvania Dr
- 1201 Hope St
- 1108 Pennsylvania Dr
- 1109 Hope St
- 1100 Bishops Park St
- 1205 Hope St
- 1212 Pennsylvania Dr
- 1104 Pennsylvania Dr
- 1101 Bishops Park St
- 1105 Hope St
- 1209 Hope St
- 1101 Abbots Ln
- 1104 Bishops Park St
- 1105 Bishops Park St
- 1100 Pennsylvania Dr
- 1105 Abbots Ln
- 1101 Hope St