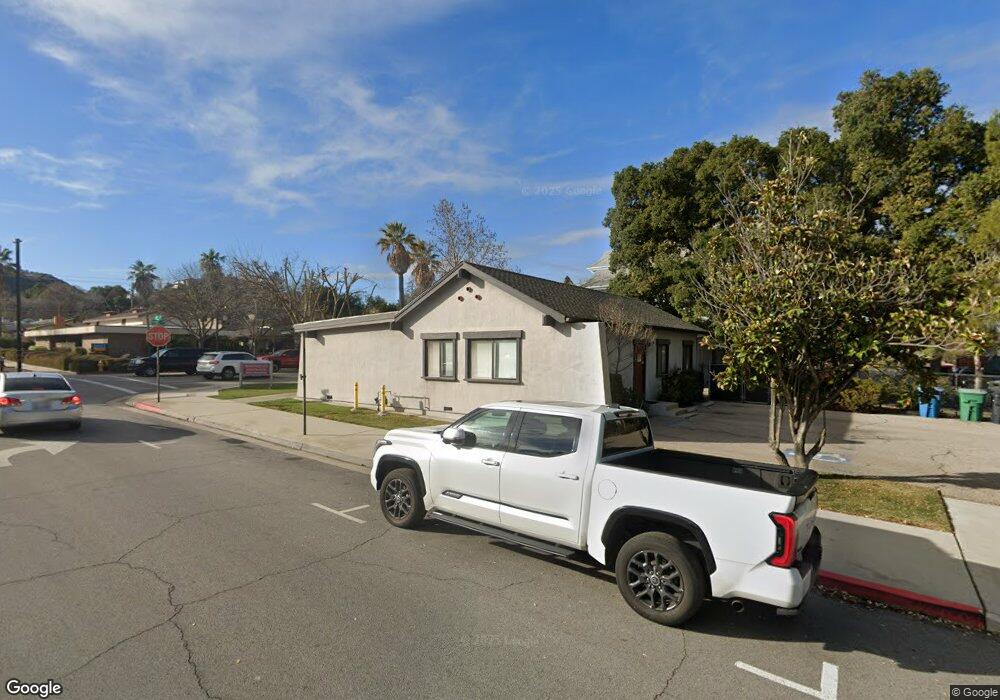
1200 Vine St Paso Robles, CA 93446
Estimated Value: $1,062,267
Studio
1
Bath
939
Sq Ft
$1,131/Sq Ft
Est. Value
About This Home
This home is located at 1200 Vine St, Paso Robles, CA 93446 and is currently estimated at $1,062,267, approximately $1,131 per square foot. 1200 Vine St is a home located in San Luis Obispo County with nearby schools including Glen Speck Elementary School, George H. Flamson Middle School, and Paso Robles High School.
Ownership History
Date
Name
Owned For
Owner Type
Purchase Details
Closed on
Nov 16, 2018
Sold by
Moroski Martin and Moroski Diane
Bought by
Moroski Martin P and Moroski Diane W
Current Estimated Value
Purchase Details
Closed on
May 3, 1999
Sold by
Madden Lori
Bought by
Madden Thomas J
Purchase Details
Closed on
Dec 22, 1997
Sold by
Lathrop John W and Lathrop Kathleen S
Bought by
Madden Thomas J and Lamacchia Lori La
Home Financials for this Owner
Home Financials are based on the most recent Mortgage that was taken out on this home.
Original Mortgage
$176,000
Interest Rate
7.16%
Mortgage Type
Commercial
Create a Home Valuation Report for This Property
The Home Valuation Report is an in-depth analysis detailing your home's value as well as a comparison with similar homes in the area
Purchase History
| Date | Buyer | Sale Price | Title Company |
|---|---|---|---|
| Moroski Martin P | -- | None Available | |
| Madden Thomas J | -- | Fidelity National Title Co | |
| Madden Thomas J | $200,000 | First American Title Ins Co |
Source: Public Records
Mortgage History
| Date | Status | Borrower | Loan Amount |
|---|---|---|---|
| Closed | Madden Thomas J | $176,000 |
Source: Public Records
Tax History
| Year | Tax Paid | Tax Assessment Tax Assessment Total Assessment is a certain percentage of the fair market value that is determined by local assessors to be the total taxable value of land and additions on the property. | Land | Improvement |
|---|---|---|---|---|
| 2025 | $3,480 | $319,316 | $103,773 | $215,543 |
| 2024 | $3,424 | $313,056 | $101,739 | $211,317 |
| 2023 | $3,424 | $306,919 | $99,745 | $207,174 |
| 2022 | $3,373 | $300,902 | $97,790 | $203,112 |
| 2021 | $3,315 | $295,003 | $95,873 | $199,130 |
| 2020 | $3,270 | $291,979 | $94,890 | $197,089 |
| 2019 | $3,224 | $286,255 | $93,030 | $193,225 |
| 2018 | $3,180 | $280,643 | $91,206 | $189,437 |
| 2017 | $2,990 | $275,141 | $89,418 | $185,723 |
| 2016 | $2,931 | $269,747 | $87,665 | $182,082 |
| 2015 | $2,921 | $265,696 | $86,349 | $179,347 |
| 2014 | $2,819 | $260,492 | $84,658 | $175,834 |
Source: Public Records
Map
Nearby Homes
Your Personal Tour Guide
Ask me questions while you tour the home.