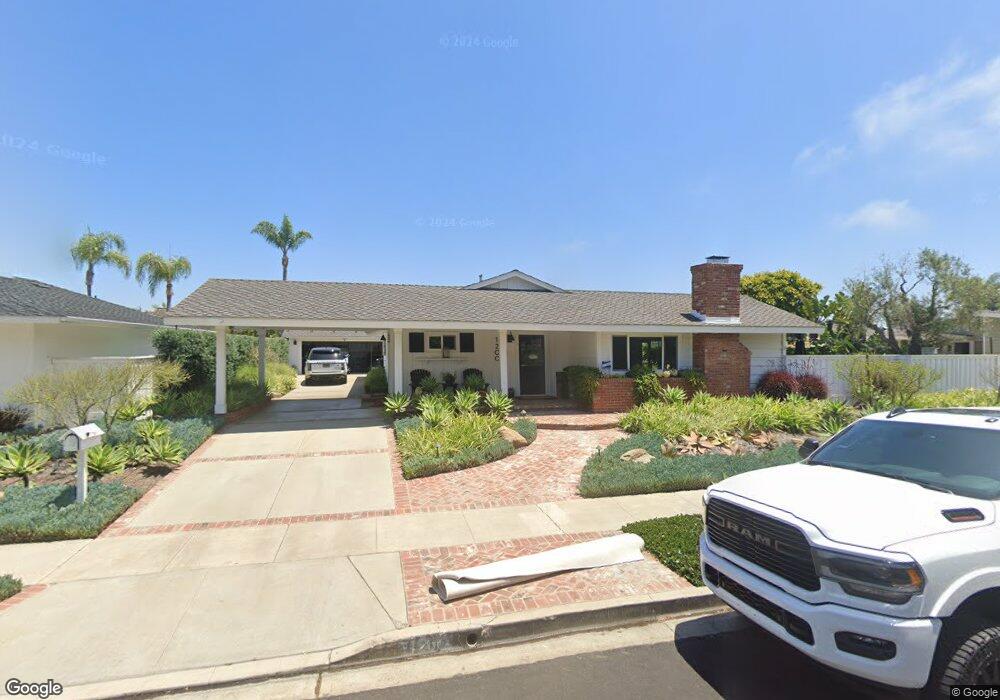
1200 Westcliff Dr Newport Beach, CA 92660
Mariners NeighborhoodEstimated Value: $2,954,000 - $3,352,000
2
Beds
2
Baths
1,909
Sq Ft
$1,661/Sq Ft
Est. Value
About This Home
This home is located at 1200 Westcliff Dr, Newport Beach, CA 92660 and is currently estimated at $3,170,814, approximately $1,660 per square foot. 1200 Westcliff Dr is a home located in Orange County with nearby schools including Mariners Elementary School, Horace Ensign Intermediate School, and Newport Harbor High School.
Ownership History
Date
Name
Owned For
Owner Type
Purchase Details
Closed on
Jul 1, 2021
Sold by
Lacy Patrick Ian and Lacy Jaclyn Diane
Bought by
Lacy Patrick Ian and Lacy Jaclyn Diane
Current Estimated Value
Purchase Details
Closed on
Jul 24, 2020
Sold by
Joslyn Gregory R and Joslyn Diane W
Bought by
Lacy Patrick Ian and Lacy Jaclyn Diane
Home Financials for this Owner
Home Financials are based on the most recent Mortgage that was taken out on this home.
Original Mortgage
$1,372,000
Outstanding Balance
$1,199,437
Interest Rate
2.37%
Mortgage Type
New Conventional
Estimated Equity
$1,971,377
Purchase Details
Closed on
Jun 14, 2016
Sold by
Joslyn Gregory R and Joslyn Diane W
Bought by
Joslyn Gregory R and Joslyn Diane W
Purchase Details
Closed on
May 5, 1994
Sold by
Manuel Darwin D
Bought by
Tiller Ralph H and Tiller Elizabeth H
Create a Home Valuation Report for This Property
The Home Valuation Report is an in-depth analysis detailing your home's value as well as a comparison with similar homes in the area
Home Values in the Area
Average Home Value in this Area
Purchase History
| Date | Buyer | Sale Price | Title Company |
|---|---|---|---|
| Lacy Patrick Ian | -- | None Available | |
| Lacy Patrick Ian | $1,715,000 | Westminster Title Co | |
| Joslyn Gregory R | -- | None Available | |
| Tiller Ralph H | -- | -- |
Source: Public Records
Mortgage History
| Date | Status | Borrower | Loan Amount |
|---|---|---|---|
| Open | Lacy Patrick Ian | $1,372,000 |
Source: Public Records
Tax History Compared to Growth
Tax History
| Year | Tax Paid | Tax Assessment Tax Assessment Total Assessment is a certain percentage of the fair market value that is determined by local assessors to be the total taxable value of land and additions on the property. | Land | Improvement |
|---|---|---|---|---|
| 2025 | $19,470 | $1,856,370 | $1,731,430 | $124,940 |
| 2024 | $19,470 | $1,819,971 | $1,697,480 | $122,491 |
| 2023 | $19,011 | $1,784,286 | $1,664,196 | $120,090 |
| 2022 | $18,694 | $1,749,300 | $1,631,564 | $117,736 |
| 2021 | $18,335 | $1,715,000 | $1,599,572 | $115,428 |
| 2020 | $5,079 | $455,220 | $319,945 | $135,275 |
| 2019 | $4,979 | $446,295 | $313,672 | $132,623 |
| 2018 | $4,880 | $437,545 | $307,522 | $130,023 |
| 2017 | $4,794 | $428,966 | $301,492 | $127,474 |
| 2016 | $4,688 | $420,555 | $295,580 | $124,975 |
| 2015 | $4,641 | $414,238 | $291,140 | $123,098 |
| 2014 | $4,531 | $406,124 | $285,437 | $120,687 |
Source: Public Records
Map
Nearby Homes
- 1232 Blue Gum Ln
- 1212 Dover Dr
- 57 Cape Andover
- 1008 Buckingham Ln Unit 17
- 508 Evening Star Ln
- 1100 Polaris Dr
- 31 Cape Andover
- 1235 Santiago Dr
- 1800 Westcliff Dr
- 1530 Anita Ln
- 301 Morning Star Ln
- 218 Evening Star Ln
- 1331 Antigua Way
- 1700 Highland Dr
- 94 Yorktown
- 1412 Santiago Dr
- 113 Yorktown
- 114 Yorktown
- 50 Saratoga
- 1399 Galaxy Dr
- 1206 Westcliff Dr
- 1112 Westcliff Dr
- 1121 Oxford Ln
- 1207 Oxford Ln
- 1115 Oxford Ln
- 1212 Westcliff Dr
- 1106 Westcliff Dr
- 1215 Oxford Ln
- 1200 Blue Gum Ln
- 1107 Oxford Ln
- 1300 Westcliff Dr
- 1301 Oxford Ln
- 1113 Grove Ln
- 1101 Berkshire Ln
- 1100 Westcliff Dr
- 1100 Essex Ln
- 1112 Grove Ln
- 1101 Oxford Ln
- 1100 Berkshire Ln
- 1306 Westcliff Dr