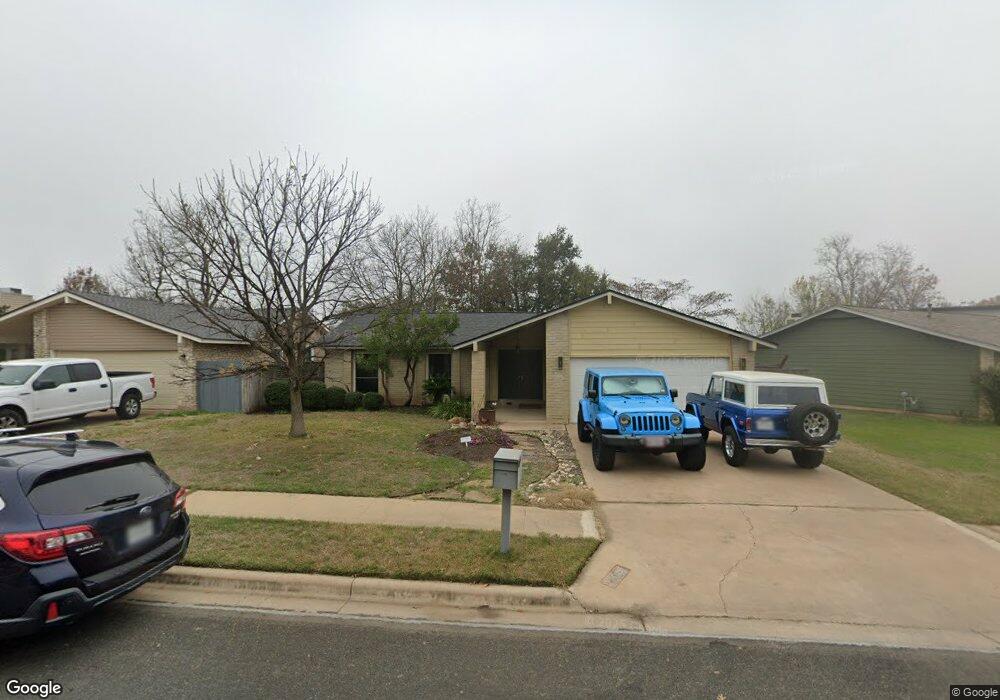
12000 Acorn Creek Trail Austin, TX 78750
Anderson Mill NeighborhoodEstimated Value: $390,204 - $448,000
3
Beds
2
Baths
1,608
Sq Ft
$256/Sq Ft
Est. Value
About This Home
This home is located at 12000 Acorn Creek Trail, Austin, TX 78750 and is currently estimated at $412,051, approximately $256 per square foot. 12000 Acorn Creek Trail is a home located in Williamson County with nearby schools including Purple Sage Elementary School, Noel Grisham Middle, and Westwood High School.
Ownership History
Date
Name
Owned For
Owner Type
Purchase Details
Closed on
Jun 16, 2008
Sold by
Harper Chris and Harper Leila
Bought by
Ketter Kelly A
Current Estimated Value
Home Financials for this Owner
Home Financials are based on the most recent Mortgage that was taken out on this home.
Original Mortgage
$174,084
Outstanding Balance
$111,709
Interest Rate
6.05%
Mortgage Type
Purchase Money Mortgage
Estimated Equity
$300,342
Purchase Details
Closed on
Apr 15, 2005
Sold by
Lohr Gil
Bought by
Harper Chris
Home Financials for this Owner
Home Financials are based on the most recent Mortgage that was taken out on this home.
Original Mortgage
$25,900
Interest Rate
5.93%
Mortgage Type
Unknown
Purchase Details
Closed on
Feb 2, 2005
Sold by
Collins Cynthia Anne
Bought by
Lohr Gil
Create a Home Valuation Report for This Property
The Home Valuation Report is an in-depth analysis detailing your home's value as well as a comparison with similar homes in the area
Home Values in the Area
Average Home Value in this Area
Purchase History
| Date | Buyer | Sale Price | Title Company |
|---|---|---|---|
| Ketter Kelly A | -- | Independence Title Company | |
| Harper Chris | -- | None Available | |
| Lohr Gil | -- | None Available |
Source: Public Records
Mortgage History
| Date | Status | Borrower | Loan Amount |
|---|---|---|---|
| Open | Ketter Kelly A | $174,084 | |
| Previous Owner | Harper Chris | $25,900 | |
| Previous Owner | Harper Chris | $103,600 |
Source: Public Records
Tax History Compared to Growth
Tax History
| Year | Tax Paid | Tax Assessment Tax Assessment Total Assessment is a certain percentage of the fair market value that is determined by local assessors to be the total taxable value of land and additions on the property. | Land | Improvement |
|---|---|---|---|---|
| 2025 | $5,892 | $391,609 | $88,500 | $303,109 |
| 2024 | $5,892 | $362,750 | $88,500 | $274,250 |
| 2023 | $5,792 | $363,112 | $0 | $0 |
| 2022 | $7,088 | $330,102 | $0 | $0 |
| 2021 | $7,372 | $300,093 | $72,000 | $252,655 |
| 2020 | $6,491 | $272,812 | $66,598 | $206,214 |
| 2019 | $6,170 | $252,246 | $60,700 | $191,546 |
| 2018 | $5,582 | $248,710 | $54,891 | $200,337 |
| 2017 | $5,643 | $226,100 | $51,300 | $194,122 |
| 2016 | $5,130 | $205,545 | $51,300 | $187,229 |
| 2015 | $4,080 | $186,859 | $42,200 | $167,383 |
| 2014 | $4,080 | $169,872 | $0 | $0 |
Source: Public Records
Map
Nearby Homes
- 12106 Grey Fawn Path
- 10902 Hard Rock Rd
- 11811 Buggy Whip Trail
- 11908 Stout Oak Trail
- 1028 Verbena Dr
- 11007 Opal Trail
- 12206 Saber Trail
- 11100 Alison Parke Trail
- 11405 Bristle Oak Trail
- 10606 Mourning Dove Dr
- 11533 Sandy Loam Trail
- 11512 Powder Mill Trail
- 12306 Split Rail Pkwy
- 11000 Anderson Mill Rd Unit 96
- 11000 Anderson Mill Rd Unit 63
- 11506 Powder Mill Trail
- 11462 Bristle Oak Trail
- 11010 Froke Cedar Trail
- 12300 Wipple Tree Cove
- 11611 Quarter Horse Trail
- 11920 Acorn Creek Trail
- 12002 Acorn Creek Trail
- 12011 Grey Fawn Path
- 11918 Acorn Creek Trail
- 12004 Acorn Creek Trail
- 12013 Grey Fawn Path
- 12009 Grey Fawn Path
- 12001 Acorn Creek Trail
- 12003 Acorn Creek Trail
- 11921 Acorn Creek Trail
- 11916 Acorn Creek Trail
- 12006 Acorn Creek Trail
- 12015 Grey Fawn Path
- 12005 Acorn Creek Trail
- 12007 Grey Fawn Path
- 12001 Grey Rock Ln
- 11919 Acorn Creek Trail
- 12008 Acorn Creek Trail
- 12017 Grey Fawn Path
- 12005 Grey Fawn Path