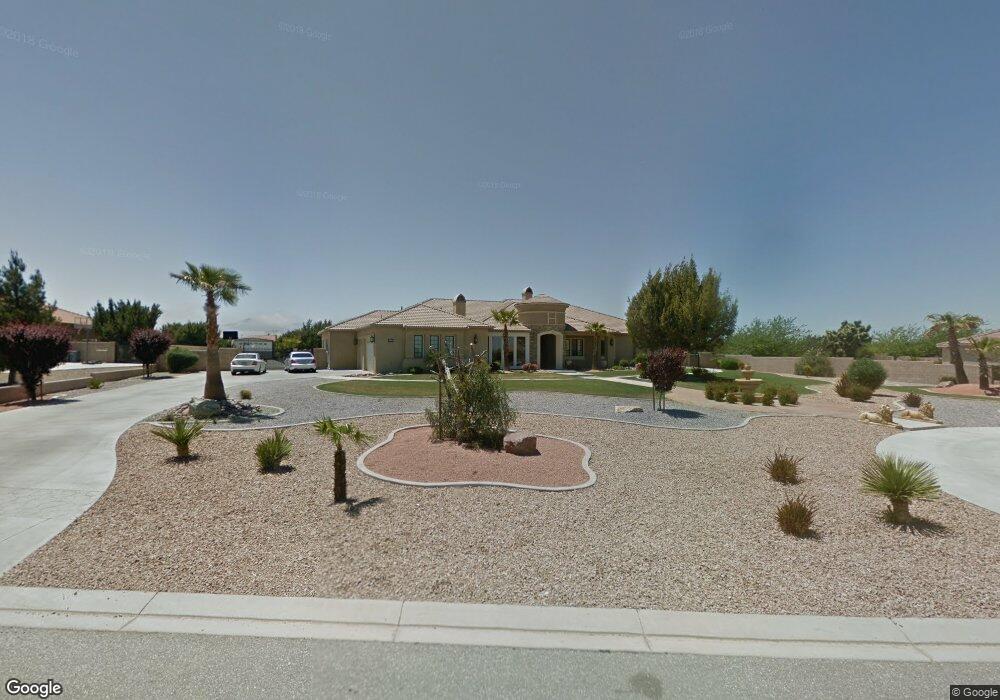
12005 Lamplighter Ln Oak Hills, CA 92344
Estimated Value: $1,033,705 - $1,374,000
5
Beds
5
Baths
4,978
Sq Ft
$232/Sq Ft
Est. Value
About This Home
This home is located at 12005 Lamplighter Ln, Oak Hills, CA 92344 and is currently estimated at $1,154,426, approximately $231 per square foot. 12005 Lamplighter Ln is a home located in San Bernardino County with nearby schools including Mission Crest Elementary School, Cedar Middle School, and Oak Hills High School.
Ownership History
Date
Name
Owned For
Owner Type
Purchase Details
Closed on
May 31, 2011
Sold by
Bhangu Avtar Singh
Bought by
Bhangu Avtar Singh and The Avtar Singh Bhangu Qualifi
Current Estimated Value
Purchase Details
Closed on
Jan 12, 2010
Sold by
Bhangu Rajinder K
Bought by
Singh Avtar
Purchase Details
Closed on
Jan 14, 2008
Sold by
Bhangu Rajinder K
Bought by
Bhangu Rajinder K and Bhangu Family Trust
Purchase Details
Closed on
Jul 7, 2003
Sold by
Gallagher Management Co
Bought by
Bhangu Rajinder K
Home Financials for this Owner
Home Financials are based on the most recent Mortgage that was taken out on this home.
Original Mortgage
$527,900
Interest Rate
6.02%
Mortgage Type
Purchase Money Mortgage
Create a Home Valuation Report for This Property
The Home Valuation Report is an in-depth analysis detailing your home's value as well as a comparison with similar homes in the area
Home Values in the Area
Average Home Value in this Area
Purchase History
| Date | Buyer | Sale Price | Title Company |
|---|---|---|---|
| Bhangu Avtar Singh | -- | None Available | |
| Singh Avtar | $310,000 | Chicago Title | |
| Bhangu Rajinder K | -- | None Available | |
| Bhangu Rajinder K | $660,000 | Chicago Title Co |
Source: Public Records
Mortgage History
| Date | Status | Borrower | Loan Amount |
|---|---|---|---|
| Previous Owner | Bhangu Rajinder K | $527,900 | |
| Closed | Bhangu Rajinder K | $65,950 |
Source: Public Records
Tax History Compared to Growth
Tax History
| Year | Tax Paid | Tax Assessment Tax Assessment Total Assessment is a certain percentage of the fair market value that is determined by local assessors to be the total taxable value of land and additions on the property. | Land | Improvement |
|---|---|---|---|---|
| 2025 | $6,803 | $589,341 | $117,869 | $471,472 |
| 2024 | $6,803 | $577,785 | $115,558 | $462,227 |
| 2023 | $6,724 | $566,456 | $113,292 | $453,164 |
| 2022 | $6,569 | $555,349 | $111,071 | $444,278 |
| 2021 | $6,448 | $544,460 | $108,893 | $435,567 |
| 2020 | $6,368 | $538,877 | $107,776 | $431,101 |
| 2019 | $6,240 | $528,311 | $105,663 | $422,648 |
| 2018 | $5,966 | $517,952 | $103,591 | $414,361 |
| 2017 | $5,861 | $507,796 | $101,560 | $406,236 |
| 2016 | $5,737 | $497,840 | $99,569 | $398,271 |
| 2015 | $5,663 | $490,362 | $98,073 | $392,289 |
| 2014 | $5,581 | $480,757 | $96,152 | $384,605 |
Source: Public Records
Map
Nearby Homes
- 0 Desford Unit CV25008719
- 0 Larch Unit HD25228920
- 0 Us-395 Hwy Unit HD25048801
- 0 Us-395 Hwy Unit IV25096908
- 7971 Outpost Rd
- 30644110 Hesperia
- 1 Coleridge Rd
- 11407 Hesperia
- 0 Vl-3064631060000 Unit HD25033163
- 11376 Medlow Ave
- 12075 Lamplighter Ln
- 11875 Lamplighter Ln
- 11971 Mission St
- 12210 Larch St
- 0 Mariposa St Unit HD25120196
- 0 Kourie Way Unit HD25024328
- 0 Kourie Way Unit HD25231616
- 1 Kourie Way
- 0 Caliente Rd Unit HD25093912
- 0 Caliente Rd Unit HD25018004
- 11985 Lamplighter Ln
- 12025 Lamplighter Ln
- 11998 Lamplighter Ln
- 0 Prarie Trail Unit CV18225441
- 0 Bellflower St Unit CV18211461
- 0 Mesa Rd Unit IV18208540
- 0 Mesa Rd Unit IV18208531
- 13082 Crystal
- 0 Aster Unit IV18049873
- 0 Aster Unit DW18000264
- 0 Rodeo Rd Unit OC17239546
- 0 Rodeo Rd Unit OC17239549
- 0 Yucca Terrace Unit C08005420
- 0 Edgehill (Forrestry) Rd Unit I08011651
- 0 Farmington Parcel #1 St Unit C08044775
- 0 Rodeo Rd Unit C08044786
- 0 Farmington Parcel #1 St Unit C08094367
- 0 Rodeo Rd Unit C08096083
- 0 Duxbury (Logical Extension) St Unit I09016989
- 0 Corner of Bolinas Los Alto Unit CC243735