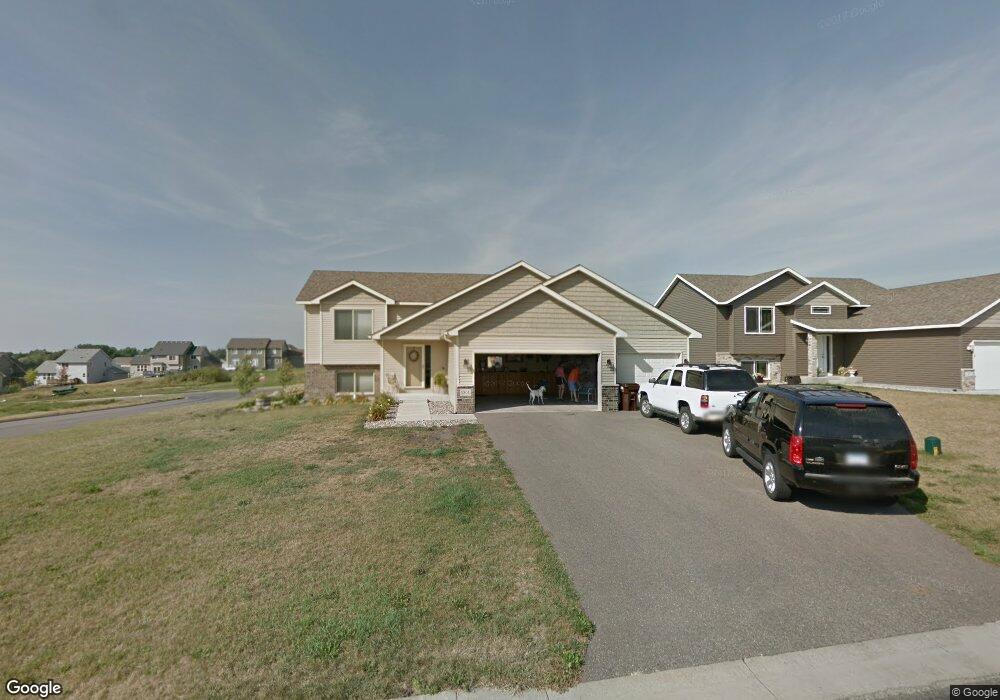
1201 1201 Olivia St SE New Prague, MN 56071
Estimated Value: $408,276 - $526,000
2
Beds
3
Baths
1,382
Sq Ft
$327/Sq Ft
Est. Value
About This Home
This home is located at 1201 1201 Olivia St SE, New Prague, MN 56071 and is currently estimated at $452,319, approximately $327 per square foot. 1201 1201 Olivia St SE is a home located in Le Sueur County with nearby schools including Raven Stream Elementary School, New Prague Middle School, and New Prague Senior High School.
Ownership History
Date
Name
Owned For
Owner Type
Purchase Details
Closed on
Feb 23, 2017
Sold by
Witt Ken and Witt Lana
Bought by
Phelps Cory L and Phelps Cathy S
Current Estimated Value
Home Financials for this Owner
Home Financials are based on the most recent Mortgage that was taken out on this home.
Original Mortgage
$196,000
Outstanding Balance
$162,307
Interest Rate
4.12%
Mortgage Type
New Conventional
Estimated Equity
$290,012
Purchase Details
Closed on
Feb 10, 2017
Sold by
Witt Ken Ken
Bought by
Phelps Corey and Phelps Cathy
Home Financials for this Owner
Home Financials are based on the most recent Mortgage that was taken out on this home.
Original Mortgage
$196,000
Outstanding Balance
$162,307
Interest Rate
4.12%
Mortgage Type
New Conventional
Estimated Equity
$290,012
Purchase Details
Closed on
Jul 21, 2009
Sold by
Not Provided
Bought by
Witt Ken and Witt Lara
Create a Home Valuation Report for This Property
The Home Valuation Report is an in-depth analysis detailing your home's value as well as a comparison with similar homes in the area
Home Values in the Area
Average Home Value in this Area
Purchase History
| Date | Buyer | Sale Price | Title Company |
|---|---|---|---|
| Phelps Cory L | $229,394 | -- | |
| Phelps Corey | $229,300 | -- | |
| Witt Ken | $161,900 | -- |
Source: Public Records
Mortgage History
| Date | Status | Borrower | Loan Amount |
|---|---|---|---|
| Open | Phelps Cory L | $196,000 | |
| Closed | Phelps Corey | $212,075 |
Source: Public Records
Tax History Compared to Growth
Tax History
| Year | Tax Paid | Tax Assessment Tax Assessment Total Assessment is a certain percentage of the fair market value that is determined by local assessors to be the total taxable value of land and additions on the property. | Land | Improvement |
|---|---|---|---|---|
| 2025 | $4,162 | $357,600 | $79,900 | $277,700 |
| 2024 | $4,060 | $342,200 | $79,900 | $262,300 |
| 2023 | $4,200 | $332,000 | $71,900 | $260,100 |
| 2022 | $4,044 | $320,900 | $71,900 | $249,000 |
| 2021 | $3,920 | $267,400 | $66,900 | $200,500 |
| 2020 | $3,946 | $255,700 | $61,900 | $193,800 |
| 2019 | $3,688 | $237,800 | $58,343 | $179,457 |
| 2018 | $3,673 | $218,900 | $57,659 | $161,241 |
| 2017 | $3,655 | $206,900 | $57,175 | $149,725 |
| 2016 | $3,236 | $199,700 | $56,860 | $142,840 |
| 2015 | $3,221 | $192,300 | $56,521 | $135,779 |
| 2014 | $3,007 | $185,200 | $56,168 | $129,032 |
| 2013 | $2,860 | $167,600 | $55,213 | $112,387 |
Source: Public Records
Map
Nearby Homes
- 1107 Olivia St SE
- 1213 Olivia St SE
- 1214 1214 Olivia St SE
- 1214 Olivia St SE
- 1230 Olivia St SE
- 1433 10th Street Cir SE
- 1106 Horseshoe Ln SE
- 1403 9th St SE
- 521 Redpoll Ave SE
- 702 Summer Ave SE
- 700 Summer Ave SE
- 605 Eastland Ave SE
- 610 Summer Ave SE
- 606 Summer Ave SE
- 608 Summer Ave SE
- 107 Horizon Dr SE
- 1514 3rd St SE
- 1501 Praha St SE
- 28792 141st Ave
- 807 Central Ave S
- 1201 Olivia St SE
- 1203 1203 Olivia-Street-
- 1203 1203 Olivia St SE
- 1203 1203 Olivia-Street-se
- 1203 Olivia St SE
- 1202 1202 Se Olivia-Street-
- 1202 1202 Olivia St SE
- 1200 Tikalsky St SE
- 1205 1205 Olivia-Street-
- 1200 Tikalsky St SE
- 1205 Olivia St SE
- 1202 Olivia St SE
- 1202 Tikalsky St SE
- 1200 Olivia St SE
- 1204 Olivia St SE
- 1113 Olivia St SE
- 1202 1202 Tikalsky-Street-se
- 1202 1202 Tikalsky St SE
- 1204 Tikalsky St SE
- 1112 Olivia St SE