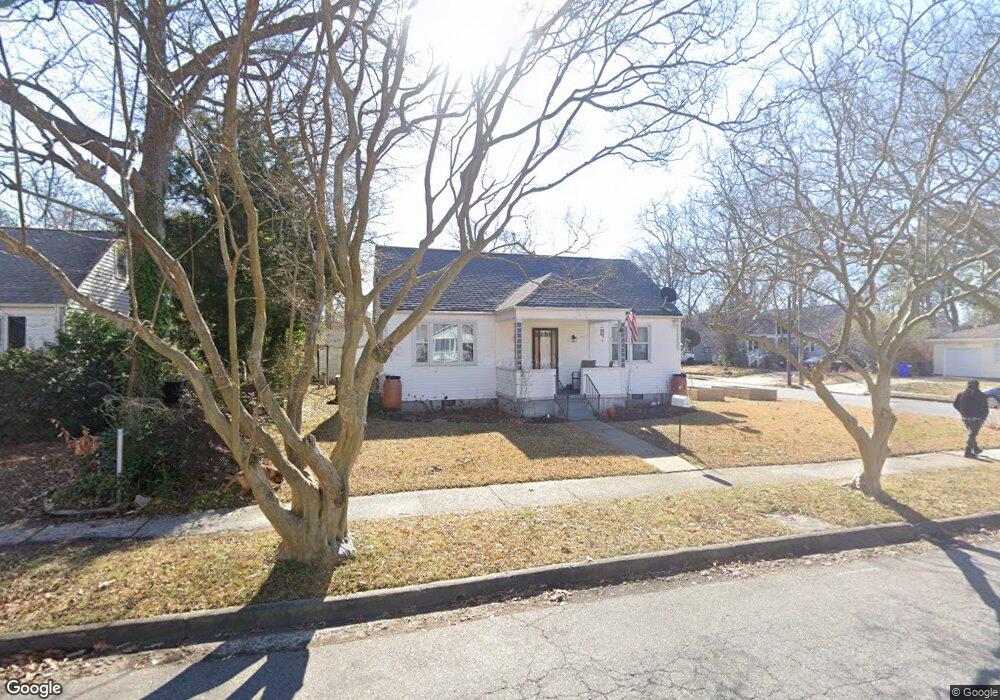
1201 Beach View St Norfolk, VA 23503
Bay View NeighborhoodEstimated Value: $277,000 - $308,000
3
Beds
1
Bath
1,395
Sq Ft
$209/Sq Ft
Est. Value
About This Home
This home is located at 1201 Beach View St, Norfolk, VA 23503 and is currently estimated at $290,909, approximately $208 per square foot. 1201 Beach View St is a home located in Norfolk City with nearby schools including Bay View Elementary School, Azalea Gardens Middle School, and Norview High School.
Ownership History
Date
Name
Owned For
Owner Type
Purchase Details
Closed on
Jun 17, 2022
Sold by
Stephanie Hawks
Bought by
Ramirez Elisa
Current Estimated Value
Home Financials for this Owner
Home Financials are based on the most recent Mortgage that was taken out on this home.
Original Mortgage
$237,500
Outstanding Balance
$225,943
Interest Rate
5.25%
Mortgage Type
New Conventional
Estimated Equity
$64,966
Purchase Details
Closed on
Jul 28, 2020
Sold by
Firestone Michael S and Firestone Donna M
Bought by
Hawks Stephanie
Home Financials for this Owner
Home Financials are based on the most recent Mortgage that was taken out on this home.
Original Mortgage
$162,000
Interest Rate
3.1%
Mortgage Type
New Conventional
Purchase Details
Closed on
Aug 16, 2007
Sold by
Lambe Edward Joseph and Lambe Maryann R
Bought by
Firestone Michael S and Firestone Donna M
Home Financials for this Owner
Home Financials are based on the most recent Mortgage that was taken out on this home.
Original Mortgage
$140,000
Interest Rate
7.25%
Mortgage Type
Purchase Money Mortgage
Create a Home Valuation Report for This Property
The Home Valuation Report is an in-depth analysis detailing your home's value as well as a comparison with similar homes in the area
Home Values in the Area
Average Home Value in this Area
Purchase History
| Date | Buyer | Sale Price | Title Company |
|---|---|---|---|
| Ramirez Elisa | $250,000 | Ellis Kenneth L | |
| Hawks Stephanie | $180,000 | Priority Title & Escrow | |
| Firestone Michael S | $175,000 | Precision Title & Settlement |
Source: Public Records
Mortgage History
| Date | Status | Borrower | Loan Amount |
|---|---|---|---|
| Open | Ramirez Elisa | $237,500 | |
| Previous Owner | Hawks Stephanie | $162,000 | |
| Previous Owner | Firestone Michael S | $140,000 |
Source: Public Records
Tax History
| Year | Tax Paid | Tax Assessment Tax Assessment Total Assessment is a certain percentage of the fair market value that is determined by local assessors to be the total taxable value of land and additions on the property. | Land | Improvement |
|---|---|---|---|---|
| 2025 | $3,315 | $265,200 | $102,200 | $163,000 |
| 2024 | $3,141 | $255,400 | $93,000 | $162,400 |
| 2023 | $3,040 | $243,200 | $93,000 | $150,200 |
| 2022 | $2,710 | $205,500 | $70,400 | $135,100 |
| 2021 | $2,250 | $180,000 | $61,000 | $119,000 |
| 2020 | $1,963 | $157,000 | $54,000 | $103,000 |
| 2019 | $1,853 | $148,200 | $49,000 | $99,200 |
| 2018 | $1,760 | $140,800 | $49,000 | $91,800 |
| 2017 | $1,567 | $136,300 | $49,000 | $87,300 |
| 2016 | $1,539 | $135,700 | $46,500 | $89,200 |
| 2015 | $1,561 | $135,700 | $46,500 | $89,200 |
| 2014 | $1,561 | $135,700 | $46,500 | $89,200 |
Source: Public Records
Map
Nearby Homes
- 8810 Devon St
- 1050 E Chester St
- 1000 Dune St
- 8911 London St
- 8723 Chesapeake Blvd
- 1212 Oak Park Ave
- 1335 Modoc Ave
- 700 Creamer Rd
- 8580 Wayland St
- 8582 Chesapeake Blvd
- 8582 Chesapeake Blvd Unit 306
- 719 Dudley Ave
- 8575 Chesapeake Blvd
- 1214 Virgilina Ave
- 511 Dune St
- 1017 E Balview Ave
- 8546 Old Ocean View Rd
- 515 Earl St
- 1381 Fishermans Rd
- 8534 Chesapeake Blvd
- 1207 Beach View St
- 8822 Devon St
- 8818 Devon St
- 8827 Devon St
- 8823 Devon St
- 1200 Beach View St
- 1215 Beach View St
- 1208 Beach View St
- 1302 Elm View Ave
- 8839 Devon St
- 8819 Devon St
- 8814 Devon St
- 1306 Elm View Ave
- 8815 Devon St
- 8826 Brighton St
- 8848 Devon St
- 1303 Calla Ave
- 8822 Brighton St
- 1307 Elm View Ave
- 8849 Devon St
Your Personal Tour Guide
Ask me questions while you tour the home.