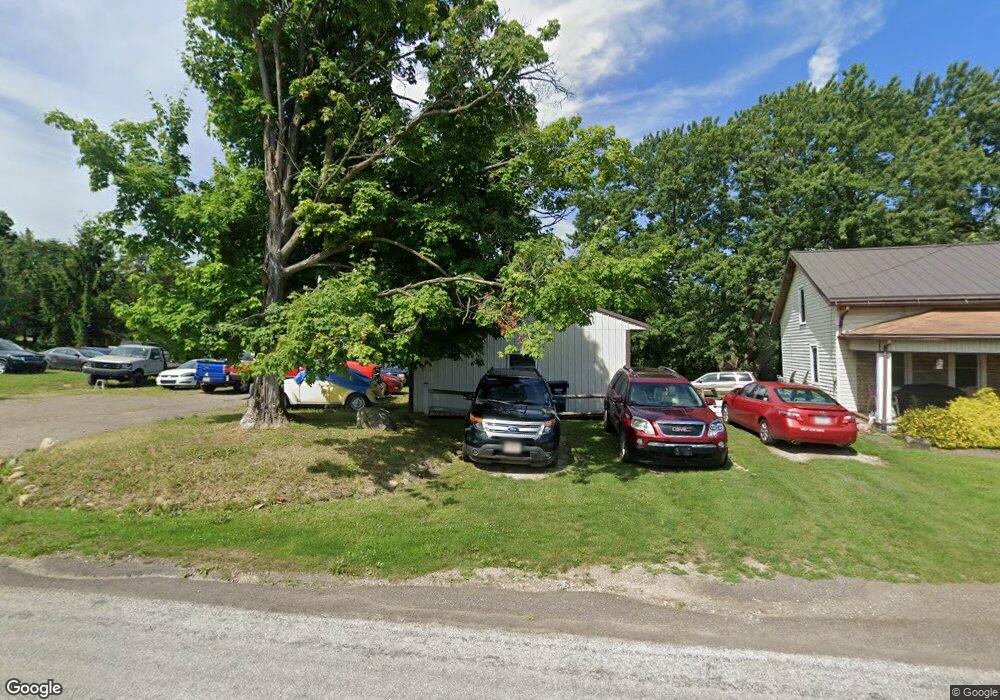
1201 County Road 2075 Ashland, OH 44805
Estimated Value: $116,000 - $189,000
2
Beds
1
Bath
1,118
Sq Ft
$139/Sq Ft
Est. Value
About This Home
This home is located at 1201 County Road 2075, Ashland, OH 44805 and is currently estimated at $155,323, approximately $138 per square foot. 1201 County Road 2075 is a home located in Ashland County with nearby schools including Hillsdale Elementary School, Hillsdale Middle School, and Hillsdale High School.
Ownership History
Date
Name
Owned For
Owner Type
Purchase Details
Closed on
Mar 29, 2024
Sold by
Bolen Benjamin R and Bolen Jody K
Bought by
Jericho Holdings Ltd
Current Estimated Value
Home Financials for this Owner
Home Financials are based on the most recent Mortgage that was taken out on this home.
Original Mortgage
$43,500
Outstanding Balance
$41,973
Interest Rate
6.77%
Mortgage Type
New Conventional
Estimated Equity
$113,350
Purchase Details
Closed on
May 25, 2010
Bought by
Bolen Benjamin R and Bolen Jody K
Purchase Details
Closed on
Feb 22, 2010
Sold by
Smith Philip
Purchase Details
Closed on
Apr 18, 2005
Sold by
Smith Philip
Bought by
Smith Philip
Purchase Details
Closed on
Dec 17, 1999
Sold by
Keller Kelly R
Bought by
Smith Philip
Purchase Details
Closed on
Nov 24, 1997
Sold by
Bright Bruce
Bought by
Keller Kelly R
Purchase Details
Closed on
Jan 1, 1990
Bought by
Bright Bruce
Create a Home Valuation Report for This Property
The Home Valuation Report is an in-depth analysis detailing your home's value as well as a comparison with similar homes in the area
Home Values in the Area
Average Home Value in this Area
Purchase History
| Date | Buyer | Sale Price | Title Company |
|---|---|---|---|
| Jericho Holdings Ltd | $58,000 | Castle Real Estate Title | |
| Jericho Holdings Ltd | $58,000 | Castle Real Estate Title | |
| Bolen Benjamin R | $30,000 | -- | |
| -- | $48,000 | -- | |
| Smith Philip | -- | -- | |
| Smith Philip | $60,000 | -- | |
| Keller Kelly R | $55,000 | -- | |
| Bright Bruce | -- | -- |
Source: Public Records
Mortgage History
| Date | Status | Borrower | Loan Amount |
|---|---|---|---|
| Open | Jericho Holdings Ltd | $43,500 | |
| Closed | Jericho Holdings Ltd | $43,500 |
Source: Public Records
Tax History Compared to Growth
Tax History
| Year | Tax Paid | Tax Assessment Tax Assessment Total Assessment is a certain percentage of the fair market value that is determined by local assessors to be the total taxable value of land and additions on the property. | Land | Improvement |
|---|---|---|---|---|
| 2024 | $1,229 | $36,290 | $4,710 | $31,580 |
| 2023 | $1,229 | $36,290 | $4,710 | $31,580 |
| 2022 | $1,071 | $25,030 | $3,250 | $21,780 |
| 2021 | $1,073 | $25,030 | $3,250 | $21,780 |
| 2020 | $1,007 | $25,030 | $3,250 | $21,780 |
| 2019 | $933 | $22,390 | $3,400 | $18,990 |
| 2018 | $903 | $22,390 | $3,400 | $18,990 |
| 2017 | $793 | $22,390 | $3,400 | $18,990 |
| 2016 | $793 | $19,470 | $2,960 | $16,510 |
| 2015 | $784 | $19,470 | $2,960 | $16,510 |
| 2013 | $809 | $18,640 | $3,470 | $15,170 |
Source: Public Records
Map
Nearby Homes
- 1183 County Road 30a
- 19 Maine St
- 1106 County Road 30a
- 945 Pike Dr
- 1048 Township Road 2156
- 3290 Shad Dr W
- 775 Touby Ln
- 2750 Lutz Ave
- 1696 Township Road 1419
- 1015 Township Road 1696
- 1690 County Road 995
- 0 Mount Zion Rd Unit 9069748
- 2495 Emma Ln
- 0 Twp Rd 1806 Unit 11591470
- 0 Satinwood Dr
- 820 County Road 30a
- 2364 Satinwood Dr
- 598 Impala Dr
- 0 Peterson Rd
- 1200 County Road 2075
- 1176 County Road 30a
- 1199 County Road 2075
- 1199 County Road 2075
- 1199A County Road 2075
- 1198 County Road 2075
- 1196 County Road 2075
- 1176 Township Road 1996
- 1176 Twp Rd 1996
- 1169 County Road 30a
- 1193 County Road 2075
- 1175 Township Road 1996
- 1167 County Road 30a
- 1165 County Road 30a
- 1175 1996
- 1984 Township Road 1165
- 1190 County Road 2075
- 1986 Township Road 1165
- 1189 County Road 2075