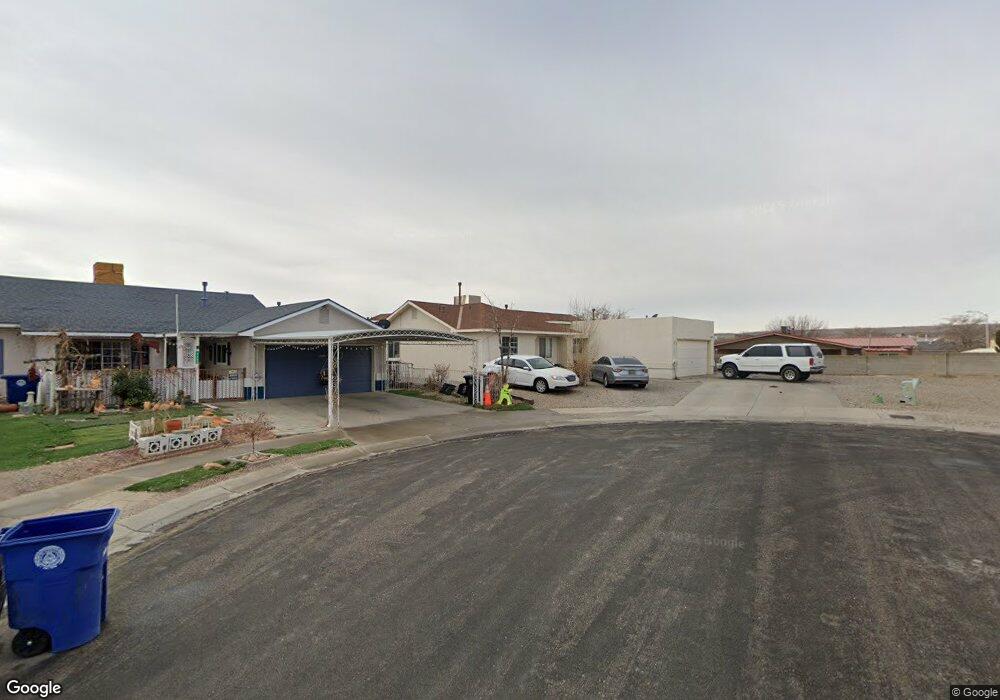
1201 Diamond Place SW Albuquerque, NM 87121
Southwest Heights NeighborhoodEstimated Value: $263,000 - $308,000
3
Beds
2
Baths
1,518
Sq Ft
$191/Sq Ft
Est. Value
About This Home
This home is located at 1201 Diamond Place SW, Albuquerque, NM 87121 and is currently estimated at $290,116, approximately $191 per square foot. 1201 Diamond Place SW is a home located in Bernalillo County with nearby schools including Maryann Binford Elementary School, Truman Middle School, and Atrisco Heritage Academy High School.
Ownership History
Date
Name
Owned For
Owner Type
Purchase Details
Closed on
Jan 2, 2008
Sold by
Sanchez Alma M and Chacon Alma M
Bought by
Sanchez Alma M
Current Estimated Value
Home Financials for this Owner
Home Financials are based on the most recent Mortgage that was taken out on this home.
Original Mortgage
$153,900
Outstanding Balance
$97,059
Interest Rate
6.23%
Mortgage Type
New Conventional
Estimated Equity
$193,057
Purchase Details
Closed on
May 10, 2006
Sold by
Costley Roy Louis
Bought by
Chacon Alma M
Home Financials for this Owner
Home Financials are based on the most recent Mortgage that was taken out on this home.
Original Mortgage
$119,200
Interest Rate
8.05%
Mortgage Type
Purchase Money Mortgage
Purchase Details
Closed on
Jun 2, 2005
Sold by
Murray Judith E and Costley Judy M
Bought by
Costley Roy Louis
Home Financials for this Owner
Home Financials are based on the most recent Mortgage that was taken out on this home.
Original Mortgage
$105,750
Interest Rate
8.54%
Mortgage Type
Fannie Mae Freddie Mac
Create a Home Valuation Report for This Property
The Home Valuation Report is an in-depth analysis detailing your home's value as well as a comparison with similar homes in the area
Home Values in the Area
Average Home Value in this Area
Purchase History
| Date | Buyer | Sale Price | Title Company |
|---|---|---|---|
| Sanchez Alma M | -- | Fidelity Natl Title Ins Co | |
| Chacon Alma M | -- | First American Title Ins Co | |
| Costley Roy Louis | -- | Multiple |
Source: Public Records
Mortgage History
| Date | Status | Borrower | Loan Amount |
|---|---|---|---|
| Open | Sanchez Alma M | $153,900 | |
| Closed | Chacon Alma M | $119,200 | |
| Previous Owner | Costley Roy Louis | $105,750 |
Source: Public Records
Tax History Compared to Growth
Tax History
| Year | Tax Paid | Tax Assessment Tax Assessment Total Assessment is a certain percentage of the fair market value that is determined by local assessors to be the total taxable value of land and additions on the property. | Land | Improvement |
|---|---|---|---|---|
| 2025 | $1,826 | $46,627 | $14,064 | $32,563 |
| 2024 | $1,826 | $45,269 | $13,654 | $31,615 |
| 2023 | $1,793 | $43,951 | $13,257 | $30,694 |
| 2022 | $1,730 | $42,671 | $12,871 | $29,800 |
| 2021 | $1,669 | $41,428 | $12,496 | $28,932 |
| 2020 | $1,639 | $40,222 | $12,132 | $28,090 |
| 2019 | $1,589 | $39,051 | $11,779 | $27,272 |
| 2018 | $1,530 | $39,051 | $11,779 | $27,272 |
| 2017 | $1,480 | $37,913 | $11,436 | $26,477 |
| 2016 | $1,435 | $35,738 | $10,780 | $24,958 |
| 2015 | $34,697 | $34,697 | $10,466 | $24,231 |
| 2014 | $1,400 | $34,964 | $10,466 | $24,498 |
| 2013 | -- | $34,964 | $10,466 | $24,498 |
Source: Public Records
Map
Nearby Homes
- 8709 Rhonda Ave SW
- 921 Roma Dora Ln
- 1420 Summerfield Place SW
- 1209 Locura Rd SW
- 1815 Shadetree Dr SW
- 8600 Kimela Ct SW
- 0 Nwq Unser and Sage SW Unit 1081546
- 0 Sage Rd SW Unit 1085259
- 9300 Jenny Ave SW
- 7814 Desert Canyon Place SW
- 1615 Quiet Desert Dr SW
- 0 Sage & 90th St SW Unit 1083191
- 7605 Windsong Place SW
- 7901 Purple Fringe Rd SW
- 9504 Sage Ranch Ct
- 9508 Sage Ranch Ct SW
- 7304 Autumn Sky Rd SW
- 9520 Sage Ranch Ct SW
- 704 Nicklaus Dr SW
- 9600 Sage Ranch Ct
- 1205 Diamond Place SW
- 1205 Diamond Place SW Unit PL
- 1204 Scotty Ct SW
- 1209 Diamond Place SW
- 8309 Sapphire St SW
- 1208 Scotty Ct SW
- 8305 Sapphire St SW
- 8401 Sapphire St SW
- 1200 Scotty Ct SW
- 1200 Diamond Place SW
- 8301 Sapphire St SW
- 1204 Diamond Place SW
- 8405 Sapphire St SW
- 1227 Diamond Place SW
- 1231 Diamond Place SW
- 1212 Scotty Ct SW
- 1208 Diamond Place SW
- 1152 Cassandra St SW
- 1201 Scotty Ct SW